Troubleshooting proxy servers
Using a web proxy server for Bravura Security Fabric to reach out to its targets
Problem
When an environment uses a proxy server to access web content, Bravura Security Fabric connectors, scripts, and other programs may not be able to reach external targets. The result is a connection timeout.
Cause
Bravura Security Fabric connectors use the Windows proxy settings (not always the ones from Control Panel > Internet Options), which must be set manually.
Solution
In an administrative command prompt, type:
netsh winhttp set proxy <my-proxy.company.com>:443
Replace the proxy server name with the one in your environment.
Restart all services (at a minimum,
iddband w3svc).
This sets the proxy server and port in the winhttp configuration that Bravura Security Fabric uses. External targets should now connect.
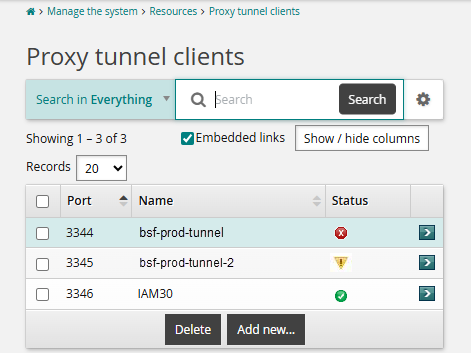
Proxy tunnel status indicators
Problem
A proxy tunnel displays a "Warning" status on the Manage the system > Resources > Proxy tunnel clients page when it is not connected to all nodes.
Cause
The Proxy tunnel clients page displays icons to indicate the proxy tunnel client status:
Green icon
 : Connected to all nodes
Yellow icon
 : Not connecting to node(s) <node list>
Red icon
 : Two possible error conditions:
Not connected: not connected to any node
No password has been assigned: This is a configuration issue. A password is required. Click Generate password to resolve.
Bravura Security Fabric does not allow for all nodes to connect to all proxies simultaneously.
Each node may only be connected to one proxy at a time
Each proxy could have any number of nodes connected to it
Intermittent network issues may also cause yellow status conditions.
Known issue
In current versions of Bravura Security Fabric (12.6+), when using multiple tunnels, the status indicator behaviour will display the yellow icon for all tunnels. This is because each Bravura Security Fabric node/instance can only connect to one tunnel at a time; thus, the tunnel status check sees the tunnel is not connected to all nodes and presents a warning indicator. This is somewhat misleading and will be clarified in future releases.
As long as each node is connected to a proxy tunnel, the system is functioning as intended. However, red icon indicators should always be investigated and treated as an issue.
Solution
Confirm that the Proxy Service is running on each proxy server. As long as each node is connected to a proxy, the system is functioning as intended.
When the proxy client displays a yellow or red status due to node connectivity issues, the primary solution is to repair the proxy client by running the Bravura Security Fabric proxy server installer and using the Repair option.
Proxy error handling and failover behavior
When Bravura Security Fabric runs agent operations against a target system, the client service checks whether the target has proxies configured. The following sequence describes how the proxy failover works:
A client service (
iddiscover,idtm, oridarch) initiates an agent operation against a target system.The service checks the target's proxy list. To view this setting, navigate to Manage the system > Resources > Target systems, select the target, and locate the "List of proxies to run connectors on" setting.
If no proxies are configured, the client service runs the agent directly on the Bravura Security Fabric server. All events are logged in
idmsuite.logon the originating server.If one proxy is configured, events appear in
idmsuite.logon both the originating server (client service events) and the proxy server (psproxyevents and agent events).If the target has more than one proxy listed, the client service attempts to connect to each proxy in list order. There is no round-robin, network distance, or load-balancing logic.
If the proxy returns no output, or the output contains
ACInvalidServerorACNotConnectederrors, the client service retries the operation on the next available proxy in the list.
Warning
An operation may succeed on the target system through the first proxy, but the client may not receive a successful result due to networking or timeout issues. In that case, the client retries the same operation through the next proxy. This can cause the second attempt to fail because the target has already been modified. For example, an add-account operation fails on the second proxy because the account already exists from the first proxy's operation.
Connector pack requirements for shared proxy servers
The connector pack file layout on the proxy must mirror the instance layout. The instance, not the proxy, determines which connector pack location the proxy uses.
If multiple instances on different servers use different global connector packs, they cannot share a single psproxy server.
Troubleshooting proxy listing errors with debug logging
When a listing operation fails through a proxy, the error message may not distinguish between an agent error and a psproxy error. For example, iddiscover may report:
Unable to run agent or get result from proxy server: 10.96.56.11/7857
for target: MN2FLBMDF701[FLB Edina - MN2FLBMDF701], error code: 1
An error code of 1 indicates an unknown error. It can originate from either the agent or the proxy level, because the proxy client framework is implemented transparently within the common agent framework. Services such as iddiscover receive results without direct knowledge of the proxy layer.
Enable debug logging
To diagnose error code 1 issues, enable verbose-level logging in iddiscover. Verbose and debug log levels contain messages about retry logic and proxy connectivity that are not visible at the default log level.
Debug log messages to look for
The following log messages help diagnose proxy connectivity and operation issues:
Connecting to a proxy:
Debug: try selected proxy:[%S], port:[%d]
On failure, attempting the next available proxy:
Debug: There are still %d proxy servers can be tried
Sending files to the proxy:
Debug: Start of ::SendFileAndMD5 [..\python\64\agtpython.exe]
to [::INSTALLDIR::\agent\agtpython.exe]
Running a command on the proxy:
Debug: sending:[runcommand2io " 600 "
"\"::INSTALLDIR::\ \agent\\agtpython.exe\" "], timeout: 60
...
Debug: received:[200 - success:aa6cedc5-a271-4e80-9b30-1bb92988b98b],
timeout: 60
If the log shows the proxy connection succeeding but the agent command failing, the issue is likely with the agent or target configuration. If the proxy connection itself fails, check network connectivity and verify that the psproxy service is running on the proxy server.