Graphs and drill-down reports
Many of the built-in analytics reports provided in Bravura Security Fabric include graphs. You can hover the cursor over the data set on each type of graph to see the statistic details.
For line graphs, you can also:
Hover over an item in the legend to highlight the relative line on the graph.
Click on an item in the legend to enable/disable the relative line on the graph.
JavaScript must be enabled for the graphs to be visible.
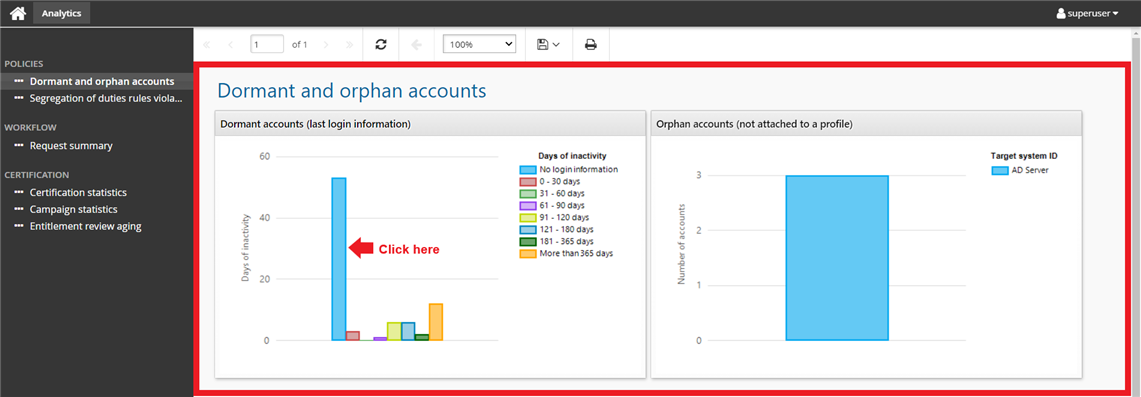
You can view a more in-depth representation of the data in any graph by clicking on an area in the graph or on any row within the table below the graph. This opens a pop-up "drill-down" window that tables data from a specific section of the graph.
For example, if you click the results of "No login information" in the graph displayed from the Dormant and orphan accounts analytics report …
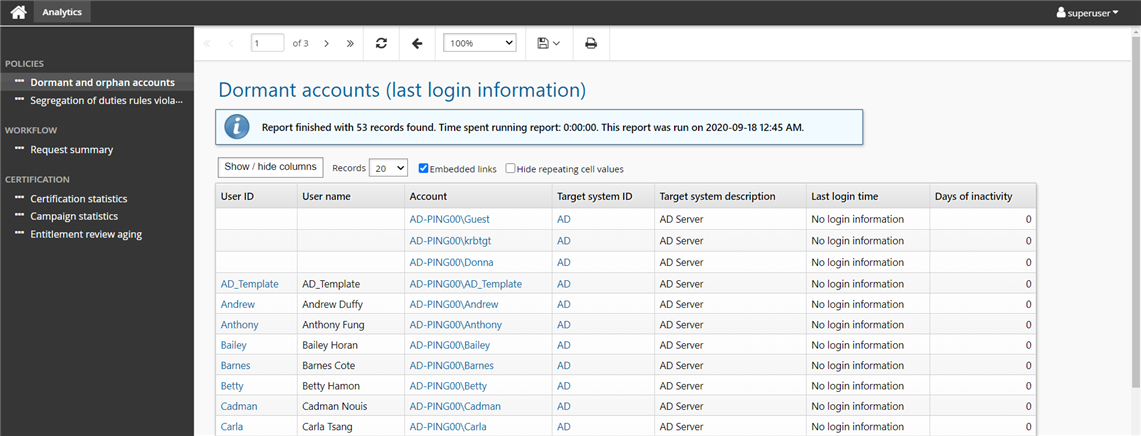
… a more detailed report displaying accounts with no login information is displayed:
For more information about graph behavior see Using graphs within reports .