Automated node check when using a load balancer
In addition to the manual process of checking the replication status, Bravura Security Fabric also presents a web-based interface that can be used to determine the status of each application node.
The application installer adds an IIS URLRewrite rule that redirects the load balancer endpoint, https://<domainname>/<instance>/api/nodestatus to cgi-bin\nodestat.exe. This CGI parses psconfig\nodestat.cfg to determine what application health verifications to run, and uses those settings to execute loadbalancerstatus.exe, which performs the actual checks.
That load balancer endpoint returns HTTP codes:
200 OKwhen all checks pass, or503 Unavailablewhen at least one check fails, or500 Internal server errorwhen something is wrong with the IIS configuration.
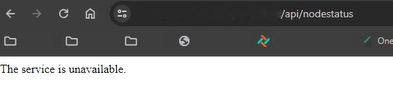
For example, when the code 503 is returned, the message "The service is unavailable" is displayed in the browser:
The list of tests to run is configured via nodestat.cfg , located at <Program Files path>\Bravura Security\Bravura Security Fabric\<instance>\psconfig. Most tests are enabled by default, and can be enabled or disabled individually by marking the item as a comment.
Bravura Security Fabric also monitors the performance of Internet Information Services (IIS). When a request takes longer than a threshold, it may mean that IIS has timed out waiting for a result and returned an error to the caller. If this happens frequently, it means this server is overloaded. API nodestatus will return 503 and this server will be taken out of the load balancer.
Timeout threshold is defined by a DWORD key in ajaxsvc registry: timeout_threshold_ms.
ajax_max_timeouts and ajax_timeout_minutes are defined in nodestat.cfg. These let you configure how many timeouts are allowed within a given number of minutes before nodestat reports a problem.
At the default (Info) level, the loadbalancerstatus tool does not log successes when everything works as expected. It logs only errors, such as when a service or another configured load balancer check fails. This does not allow you to verify whether the load balancer is actually checking the application node via its nodestatus endpoint, or how often.
To do this and collect both successes and failures, there are two options:
Increase the utility’s logging to debug level, which logs much more detail on each endpoint invocation:
psdebug -level 5 -prog loadbalancerstatus
Enable the configurable option to log entries to an SQLite database (which will grow quickly and must be trimmed manually and regularly so that it does not grow without limit).
Variable | Description |
|---|---|
$Services | A group of tests that confirm that the given service is running. Note that
|
Disk | Returns success if the node’s replication queues have not hit the high water mark. |
Ping | Calls the ping stored procedure to confirm that the database can be contacted. |
db_commit_suspend | Returns success unless this node has suspended database commit operations, which typically occur during resynchronization or when a replication queue has become full. |
Record = nodestat.db | Enables recording test results to a database flatfile, and defines the name of that file. This database is automatically written to the <instance>\db\nodestatus directory. |
ajax_max_timeouts = 10 | Number of ajax timeouts to watch for. |
ajax_timeout_minutes = 5 | Number of minutes over which to observe ajax timeouts. |
Plugin = "loadbalancerstatus.py" | Calls the plugin located at <instance>\plugin to evaluate this node’s status. Returns success if the plugin succeeds. |