Viewing dashboards
The View dashboards (dash) console displays graphical summary reports of statistics for Bravura Security Fabric operation and usage. The following sections provide general information about using dashboards, and in particular, the View dashboards (DASH) console.
Read the following sections to learn about:
Caching
Graphs and drill-down reports
Certification dashboard
Privileged access dashboards
Workflow dashboard
OrgChart dashboard
Enrollment dashboard
Help desk dashboard
Click below to view a demonstration:
See also
The Health check monitor dashboard is also displayed if the user has the required privileges.
Caching
Some dashboards use cached data. Product administrators with the "Recompute dashboard cache" privilege can use the Update button on cached dashboards (identified by having a last update time). A message is displayed while the dashboard is being updated and the Update button is not available during that time.
You can use system variables in the Manage the system > Modules > View dashboards (DASH) menu to determine if the cached data on a dashboard needs to be recalculated upon visiting the page.
Graphs and drill-down reports
Some dashboards include graphs of statistics found on the page. You can hover the cursor over the data set on each type of graph to see the statistic details.
For line graphs, you can also:
Hover over an item in the legend to highlight the relative line on the graph.
Click on an item in the legend to enable/disable the relative line on the graph.
JavaScript must be enabled for the graphs to be visible.
Product administrators who have the privilege to view a specific dashboard can view a more in-depth representation of the data in any graph by clicking on an area in the graph or on any row within the table below the graph. This opens a pop-up "drill-down" window that tables data from a specific section of the graph. A basic search box within the window allows you to filter data within the table.
For more information about graph behavior see Using graphs within reports .
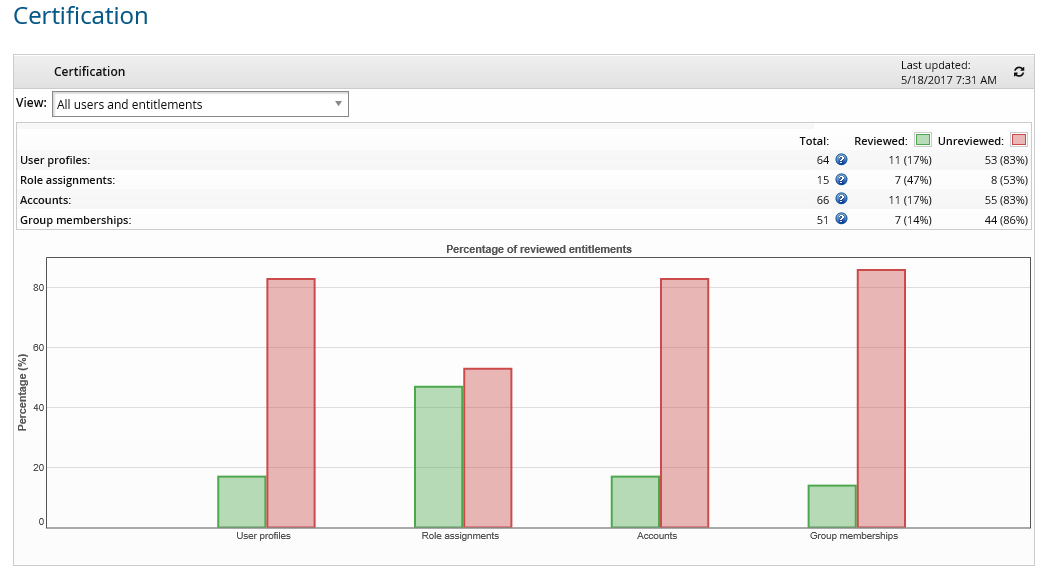
Certification dashboard
Product administrators with the privileges listed here can click View dashboards > Certification to see statistics of entitlements in the system.
Privileges
There are four views available, depending on privileges of the dashboard viewer:
All users and entitlements shows general view of certification statistics for all the users and entitlements.
Current certification campaigns initiated by me shows certification statistics for active campaigns started by me.
Direct subordinates shows certification statistics for my direct subordinates only.
All subordinates shows certification statistics for all my subordinates, direct and indirect.
Data
On the dashboard, entitlements fit into two categories based on their status of certification:
Reviewed: number of entitlements that have been certified and have been signed off.
Unreviewed: number of entitlements that are not signed off yet.
The entitlements include profiles, accounts, roles and managed group memberships. A vertical bar graph is included to display this set of statistics.
The current activity displays the statistics of active certification campaigns.
Both sets of data (entitlements and current activity) are cached.
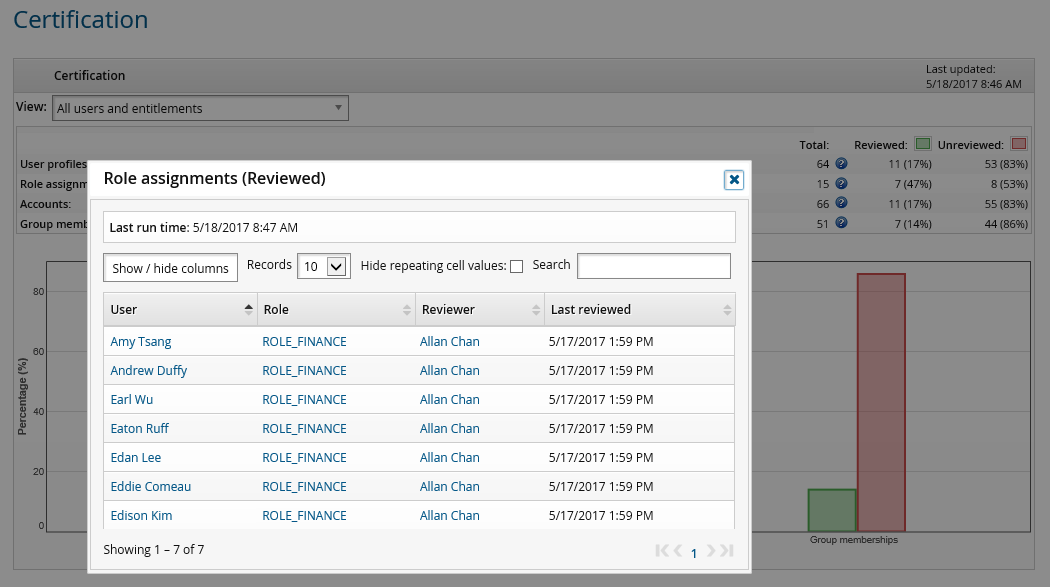
Graphs and data
If you have the "View certification dashboard" privilege, you can view in-depth data in a pop-up window by clicking on elements within a graph.
Privileged access dashboards
Product administrators with the "View privileged access dashboard" privilege can click View dashboards > Privileged access to view live summary reports.
You can change the span of the results by selecting the time span from the drop-down boxes. You can generate more detailed reports from the menu.
There are bar graphs for the number of check-outs, blocked check-outs, pending check-outs and pending requests for managed accounts and group sets.
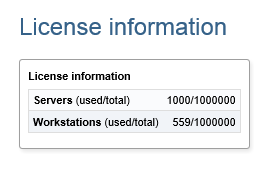
This dashboard reports on the number of servers and workstations managed by Bravura Security Fabric . Servers and workstations are counted if they are non-vault, non-deleted managed systems, belong to a primary managed system policy (not historical), and have an account with at least one password on a managed system policy . The type defaults to server unless it was auto discovered and the source of discovery declared it as a workstation.
To access this dashboard, click View dashboards > Privileged access > License information.
This dashboard does not use cached data.
Product administrators can view other license information on the Manage the system main menu .
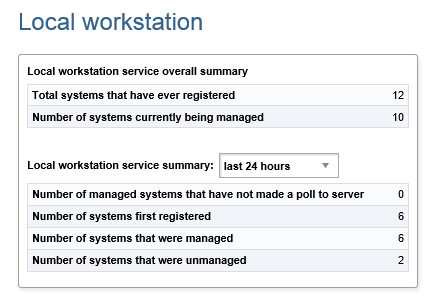
This dashboard reports on local workstation service statistics, including the number that have registered to the Bravura Privilege server, number of systems that are currently managed by Bravura Privilege , and number of systems that are unmanaged.
To access this dashboard, click View dashboards > Privileged access > Local workstation. This dashboard is split into two sections:
Local workstation service overall summary: these statistics are not based on a time interval
Local workstation service summary: these statistics are restricted to the specified time interval. You can select various time intervals from the drop-down list to calculate the statistics.
This dashboard does not use cached data.
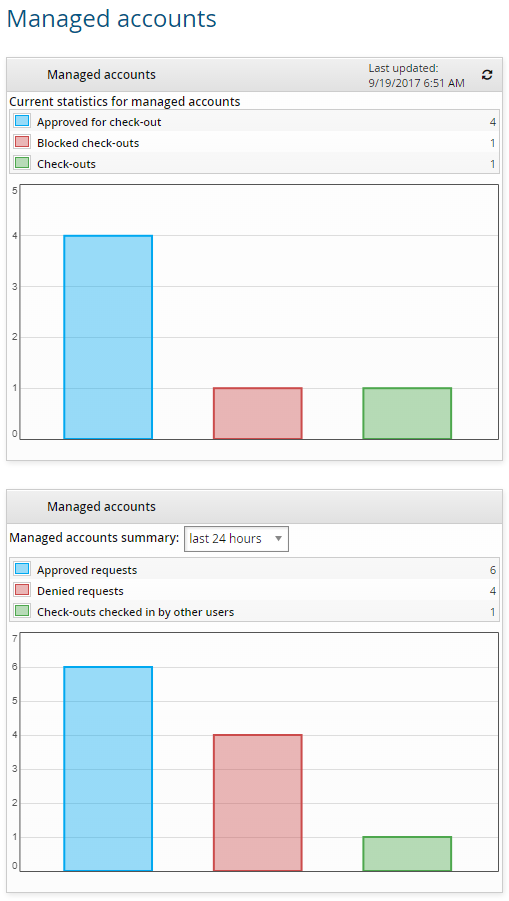
This dashboard reports on managed account statistics, including the number of accounts currently checked out, blocked check-outs, and requests approved for check-out.
To access this dashboard, click View dashboards > Privileged access > Managed accounts. This dashboard is split into two sections:
Current statistics for managed accounts: these statistics are not based on a time interval
Managed accounts summary: these statistics are restricted to the specified time interval. You can select various time intervals from the drop-down list to calculate the statistics.
Only the current statistics for managed accounts are cached.
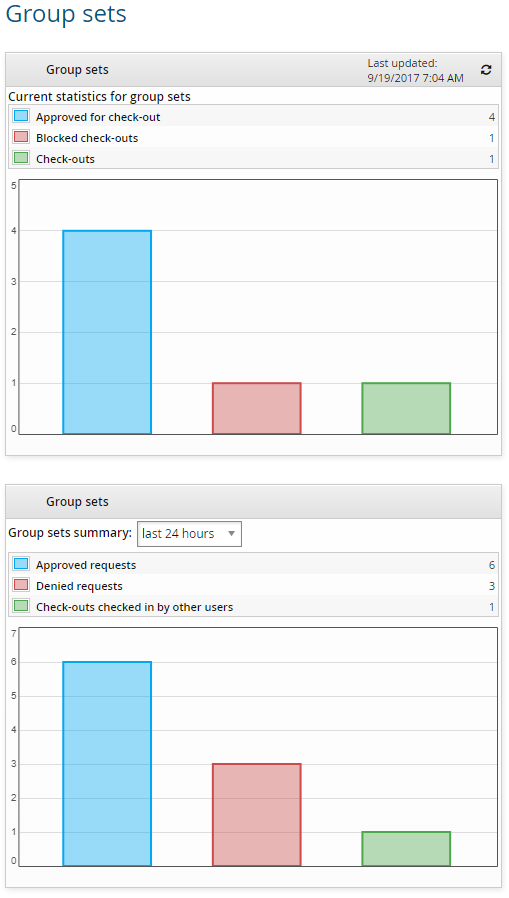
This dashboard reports on group set statistics, including the number of group sets currently checked out, blocked check-outs, and requests approved for check-out.
To access this dashboard, click View dashboards > Privileged access > Group sets. This dashboard is split into two sections:
Current statistics for group sets: these statistics are not based on a time interval
Group sets summary: these statistics are restricted to the specified time interval. You can select various time intervals from the drop-down list to calculate the statistics.
Only the current statistics for group sets are cached.
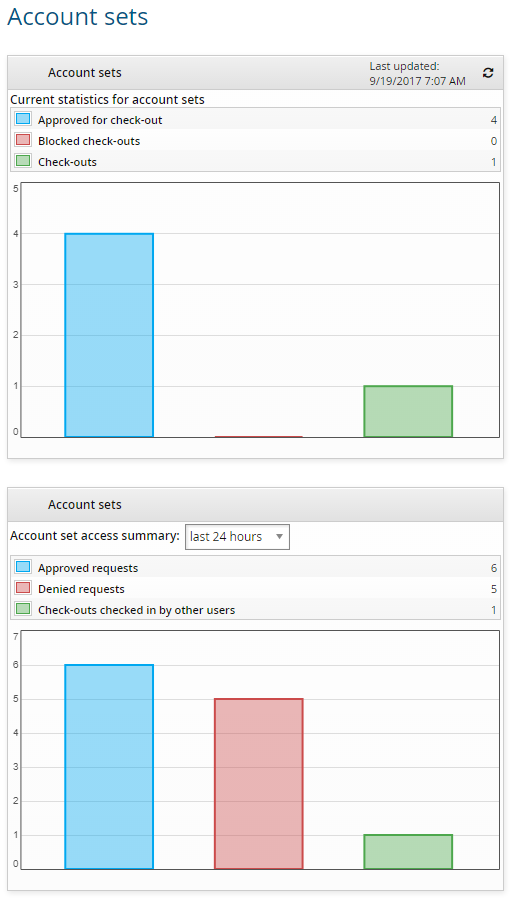
This dashboard reports on account set statistics, including the number of account sets currently checked out, blocked, and approved for check-out.
To access this dashboard, click View dashboards > Privileged access > Account sets. This dashboard is split into two sections:
Current statistics for account sets: these statistics are not based on a time interval
Account set access summary: these statistics are restricted to the specified time interval. You can select various time intervals from the drop-down list to calculate the statistics.
Only the current statistics for account sets are cached.
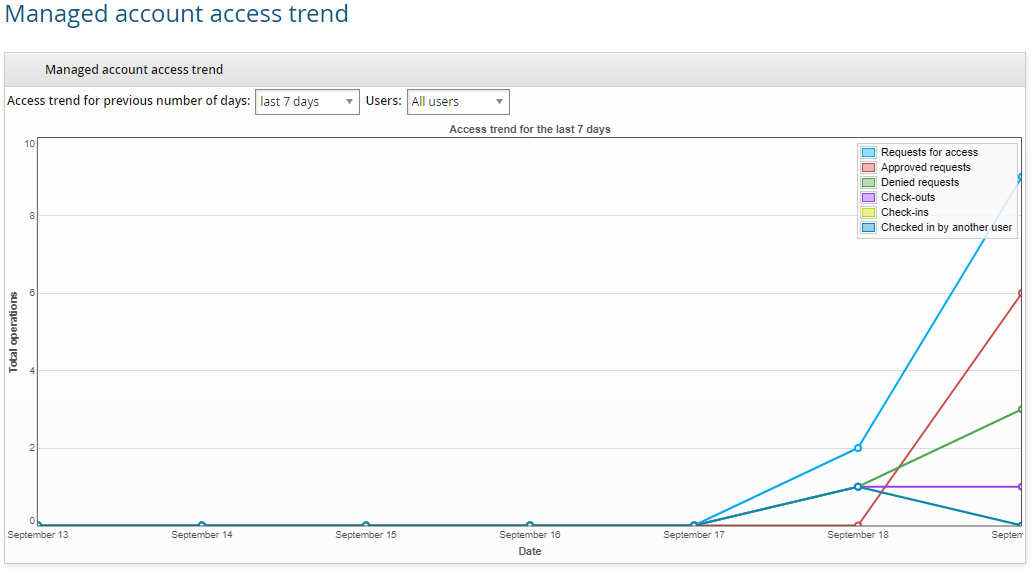
This dashboard reports on the trend analysis of managed account access check-outs, including the number of requests for access, approved requests, denied requests, and accounts checked out and checked in. You can select various time intervals and user profiles from the drop-down list to calculate the statistics.
To access this dashboard, click View dashboards > Privileged access > Managed account access trend.
In addition, product administrators with the "View privileged access dashboard" privilege also require the "View properties for this policy" access control for the managed system policy the managed accounts are bound to.
This dashboard does not use cached data.
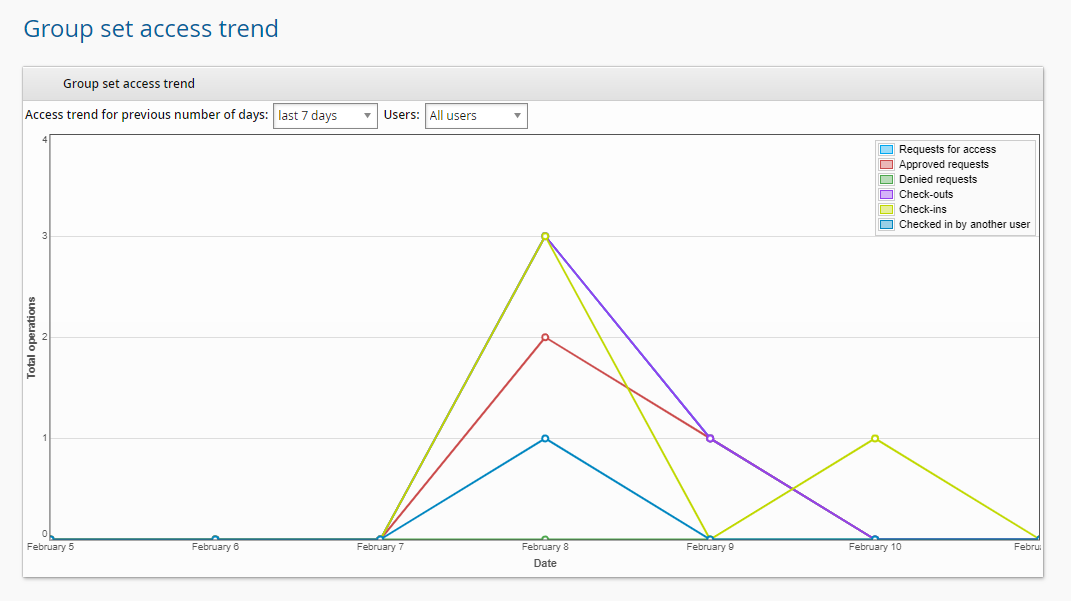
This dashboard reports on the trend analysis of group set access check-outs, including the number of requests for access, approved requests, denied requests, and group sets checked out and checked in. You can select various time intervals and user profiles from the drop-down list to calculate the statistics.
To access this dashboard, click View dashboards > Privileged access > Group set access trend.
In addition, product administrators with the "View privileged access dashboard" privilege also require the "View properties for this policy" access control for the managed system policy the group sets are bound to.
This dashboard does not use cached data.
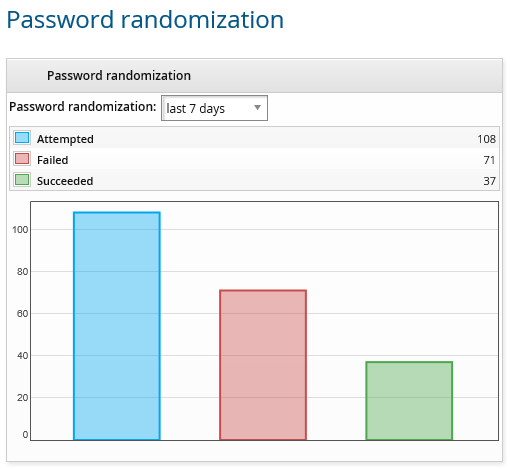
This dashboard reports on password changes statistics for managed accounts including successful and failed changes. These statistics are restricted to the specified time interval. You can select various time intervals from the drop-down list to calculate the statistics.
To access this dashboard, click View dashboards > Privileged access > Password randomization.
This dashboard does not use cached data.
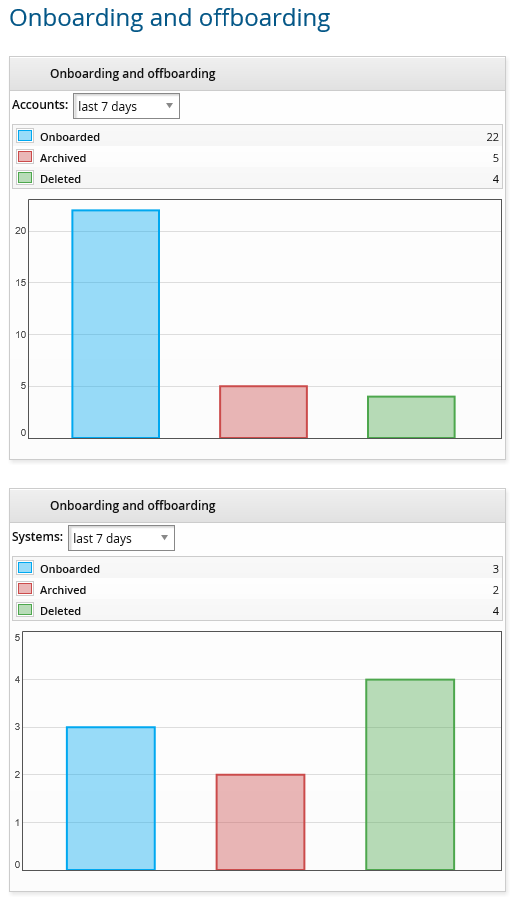
This dashboard reports on statistic of systems and accounts that have been onboarded and offboarded. These statistics are restricted to the specified time interval. You can select various time intervals from the drop-down list to calculate the statistics.
To access this dashboard, click View dashboards > Privileged access > Onboarding and offboarding.
This dashboard does not use cached data.
Workflow dashboard
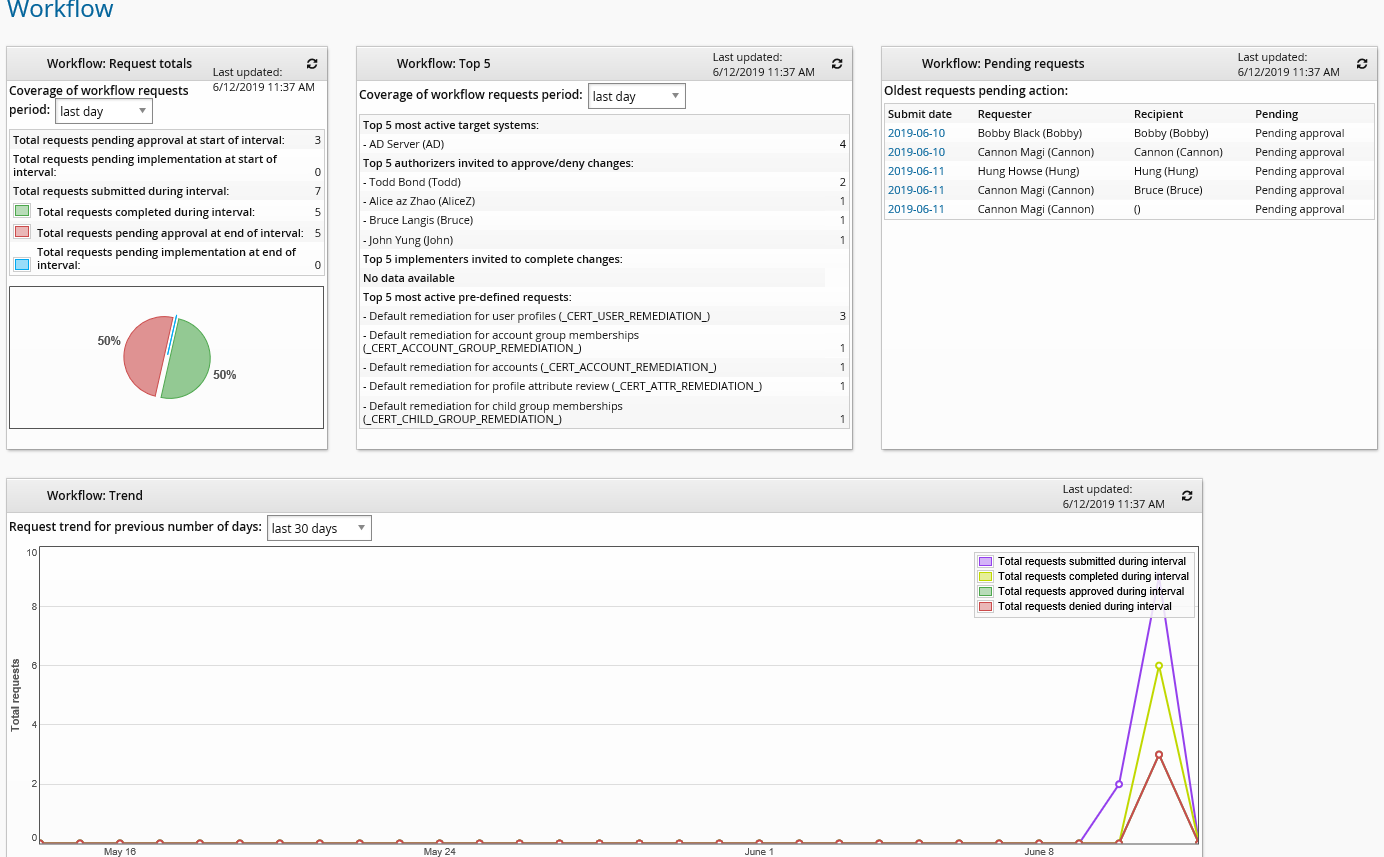
Product administrators with the "View workflow dashboard" privilege can click View dashboards > Workflow to see statistics of requests that are submitted, completed, pending authorization and pending implementation.
A pie graph is included to display the following statistics:
Total requests completed during interval
Total requests pending approval at end of interval
Total requests pending implementation at end of interval
The dashboard also includes statistics for Top 5 most active target systems, Top 5 authorizers invited to approve/deny changes, Top 5 implementers invited to complete changes, Top 5 most active pre-defined requests and the 10 Oldest requests that are pending action.
The line graph included at the bottom of the page displays the trend of requests submitted, completed, approved and denied per day over a period of days. A circle on the line graph represents a data point over a specific day. Hovering over a circle will highlight the data point.
The pie graph is only visible if there is data during the selected time period. All the data on this page is displayed based on UTC.
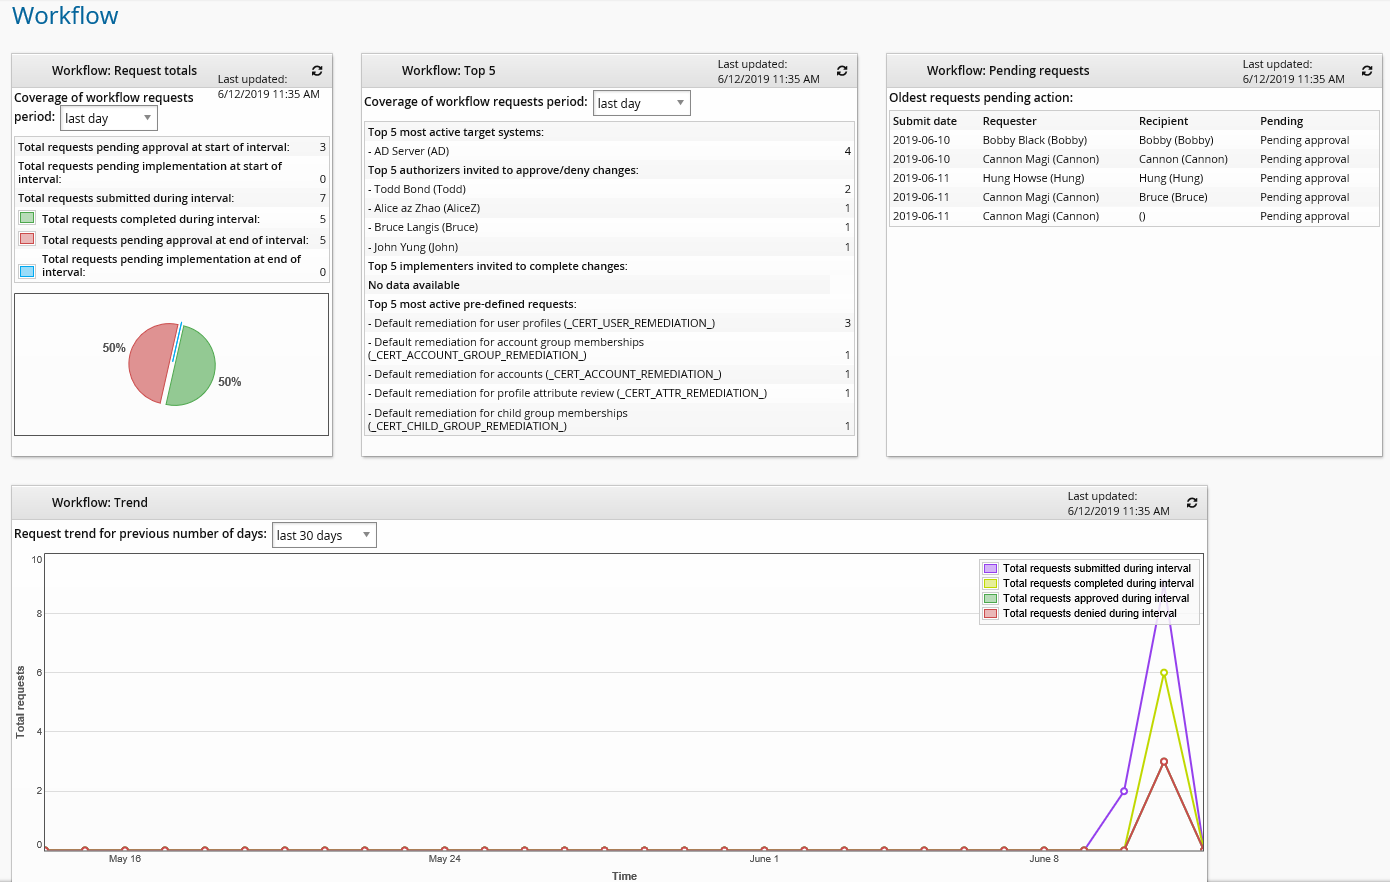
If the product administrator is also a workflow manager, data in the "Submit date" column in "Workflow:Pending request" box is presented as linkable. The request detail page will be opened by clicking these links.
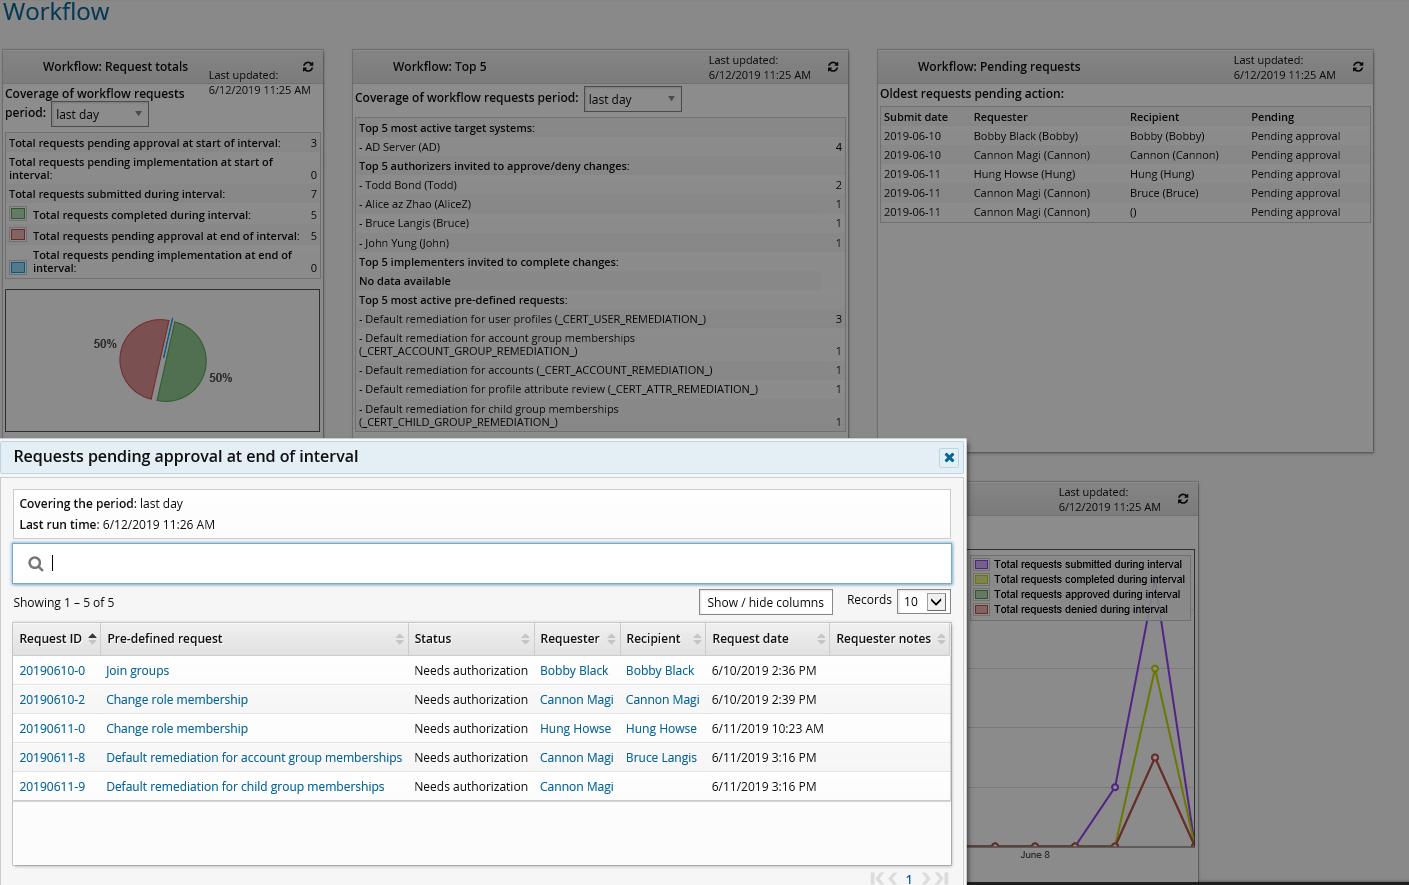
Graphs and data
If you have the "View workflow dashboard" privilege, you can view in-depth data in a pop-up window by clicking on elements on the pie chart or circles on the line graph.
OrgChart dashboard
Product administrators with the "View OrgChart dashboard" privilege can click View dashboards > OrgChart to see OrgChart statistics. This includes numbers of managers and subordinates, orphan profiles, participants in Org building rounds and requests to attach and detach.
This dashboard does not use cached data.
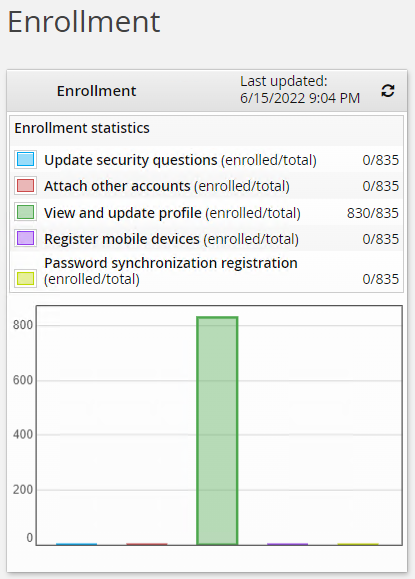
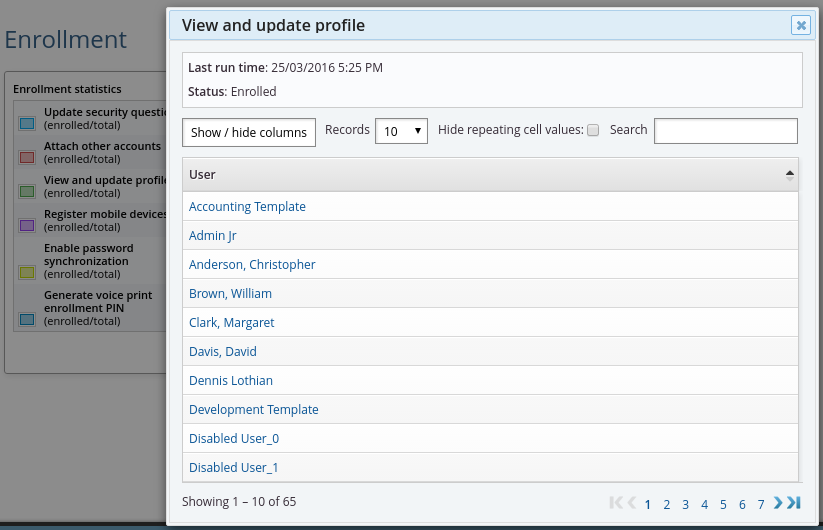
Enrollment dashboard
Product administrators with the "View enrollment dashboard" privilege can click View dashboards > Enrollment to see statistics for the number of users who have completed enrollment requirements, such as completing a security question profile, attaching alternate login IDs, updating profile information, enabling password synchronization, generating voice print enrollment PINs or registering mobile devices. A bar graph is included to display the enrollment statistics.
This dashboard uses cached data. A total difference of more than 50 users will trigger the dashboard to be recalculated. For example, if 55 users were added and 50 where removed before the page is revisited, the View dashboards (dash) module will only see a difference of five users and will not recalculate the dashboard.
Graphs and data
If you have the "View enrollment dashboard" privilege, you can view in-depth data in a pop-up window by clicking on elements within a graph.
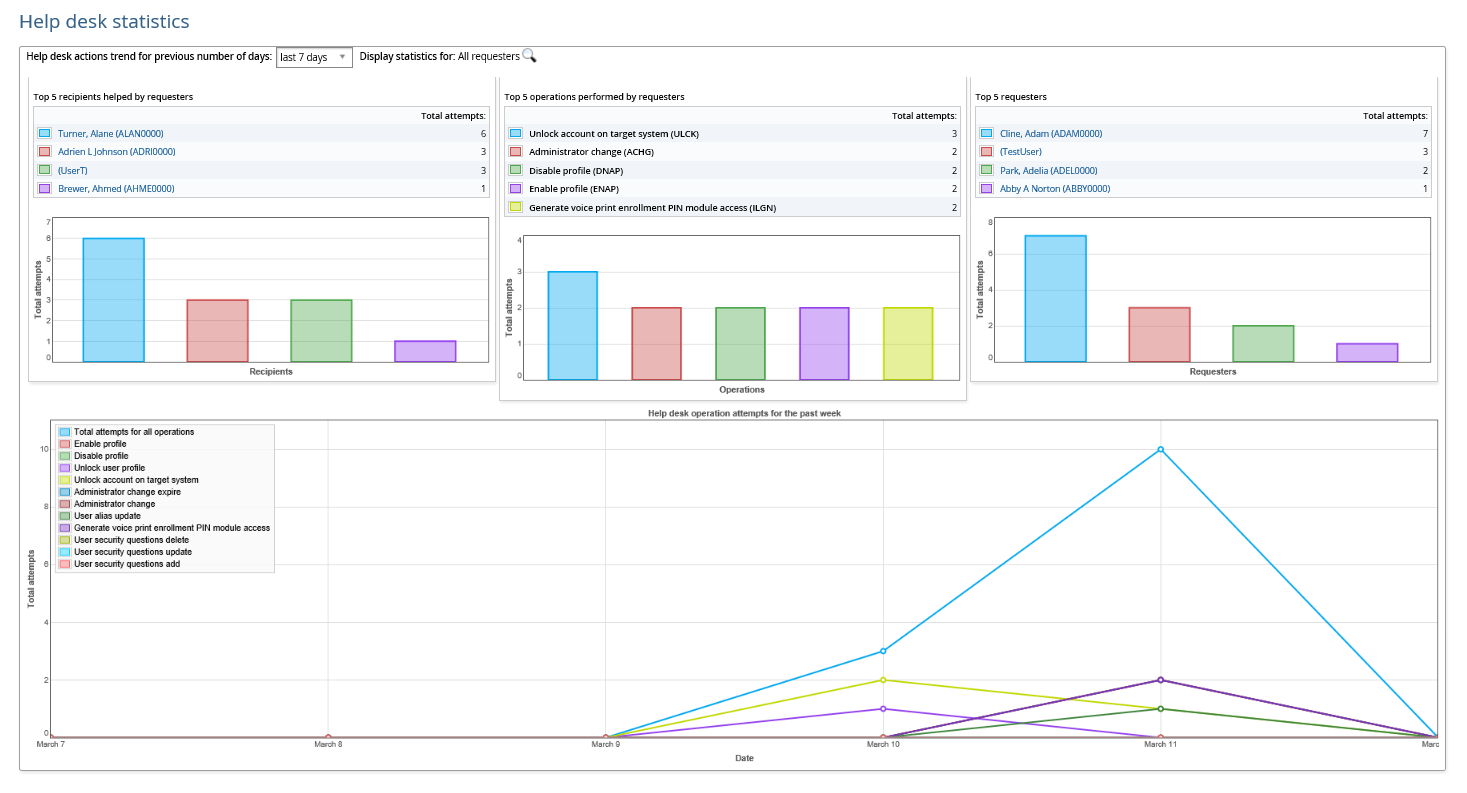
Help desk dashboard
Product administrators who have the "View help desk dashboard" privilege can click View dashboards > Help desk to view information about all operations in the Help users (IDA) module by help desk users or help desk managers.
The Help desk statistics page shows three bar graphs:
Top five users helped by a help desk user or a help desk manager along with a bar chart
Top five operations performed by a help desk user or a help desk manager along with a bar chart
Top five help desk users or help desk managers performing help operations along with a bar chart
Hover over a bar to see statistic details. Click on a bar to view a pop-up window with a list of detailed records performed for a specific user helped, a specific help operation or a help desk user or a help desk manager.
The line graph included at the bottom of the page displays the trend of performed operations per day over a period of days. You can:
Hover over the data set to see statistic details.
Click on the data set to view a pop-up window with a list of detailed records performed for a specific help desk operation. The information includes the operation that was performed, when the operation was performed, the requester, the recipient and the result.
Hover over an item in the legend to highlight the relative line on the graph.
Click on an item in the legend to enable/disable the relative line on the graph.
Use the  facility to focus the statistic on a particular user.
You can pin graphs by hovering over the pin symbol  and selecting Pin an object.