Managing and using analytics
Requirements
The analytics feature requires SQL Server Reporting Service (SSRS). The version of SSRS must be the same version as the SQL Server for the instance; for example, SQL Server 2016 and SSRS 2016.
In order to use the Analytics app, the feature must be configured:
If you do not see Analytics on the main menu, it has not been installed.
To access the Analytics app users require the "Analytics" administrative right or have membership criteria which is defined by the _ANALYTICS_READERS_ user class.
Microsoft’s Report Builder must be installed on the user’s computer to create new reports.
Report display
Analytics reports and some fields can be shown or hidden using a filter plugin. See Options.
The four report elements below can appear in a SSRS report created on the SSRS server and displayed in the Analytics app:
Records per page Number of records per page to be shown. 10, 20, 50, or 100 records can be shown per page.
Show/hide columns A selection list of report columns which can be shown or hidden. By default they are shown.
Embedded links A popup opens when a report item that has embedded link is clicked.
Hide repeating cells A checkbox when enabled allows report cells showing identical information to be hidden. By default they are shown.
These custom elements are configured in reports created on the SSRS server.
Navigation
All Bravura Security Fabric apps, including the analytics app, utilize a responsive user interface (UI). Depending on the app and your permissions, you will have different options available, however, all of the apps have a common navigation scheme.
The navigation scheme has been designed to be intuitive, and works from left to right, across the screen. When you select a report from the left panel, the results are displayed in the Results panel.
Top panel
The top panel provides options such as navigating through the displayed report, refreshing the report, exporting and printing the report.
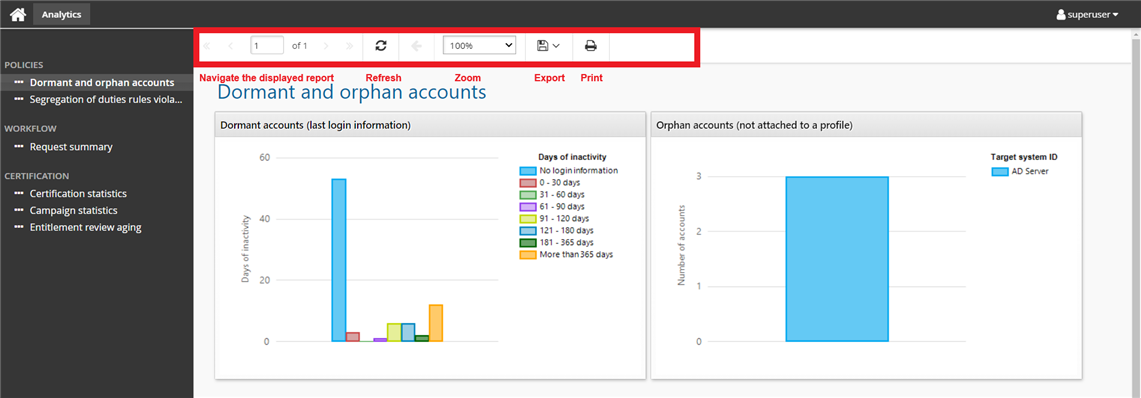
Left panel
The left panel appears on the left side of the app window and displays all of the categories and each report within each category.
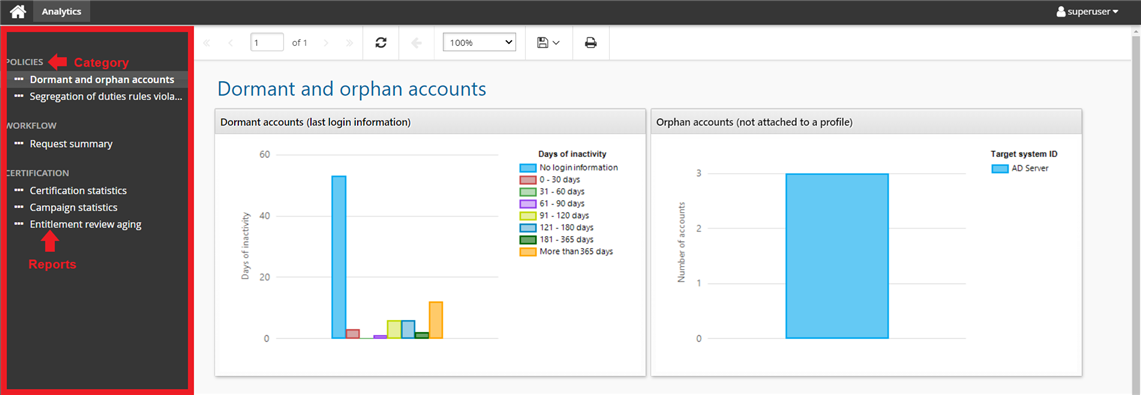
When you click on a report in the left panel, the results become active in the Results panel.
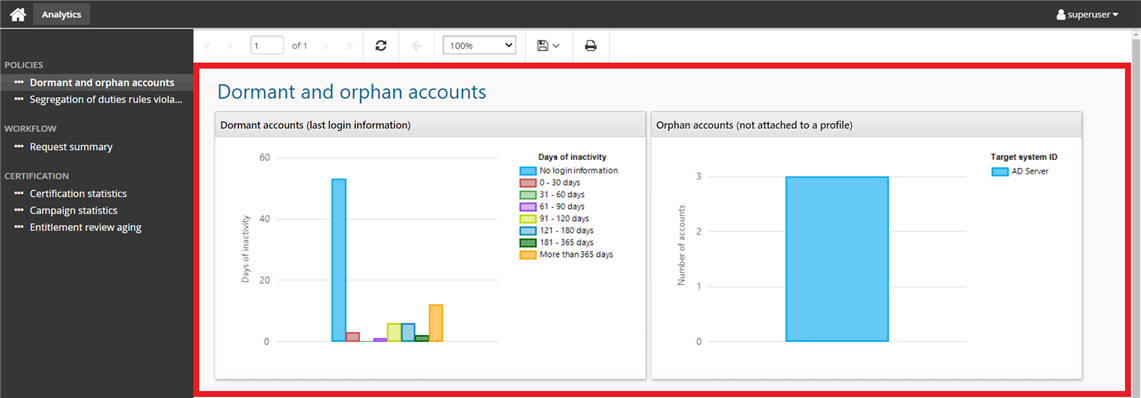
Middle panel
The middle panel, or sometimes known as the Results panel is the area next to the left panel and displays the results from a link that is selected from the left panel.
Graphs and drill-down reports
Many of the built-in analytics reports provided in Bravura Security Fabric include graphs. You can hover the cursor over the data set on each type of graph to see the statistic details.
For line graphs, you can also:
Hover over an item in the legend to highlight the relative line on the graph.
Click on an item in the legend to enable/disable the relative line on the graph.
JavaScript must be enabled for the graphs to be visible.
You can view a more in-depth representation of the data in any graph by clicking on an area in the graph or on any row within the table below the graph. This opens a pop-up "drill-down" window that tables data from a specific section of the graph.
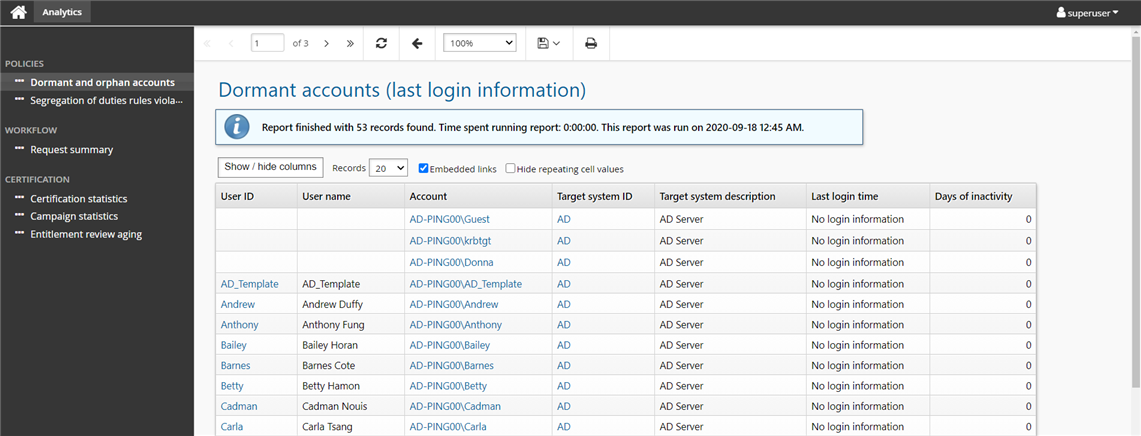
For example, if you click the results of "No login information" in the graph displayed from the Dormant and orphan accounts analytics report …
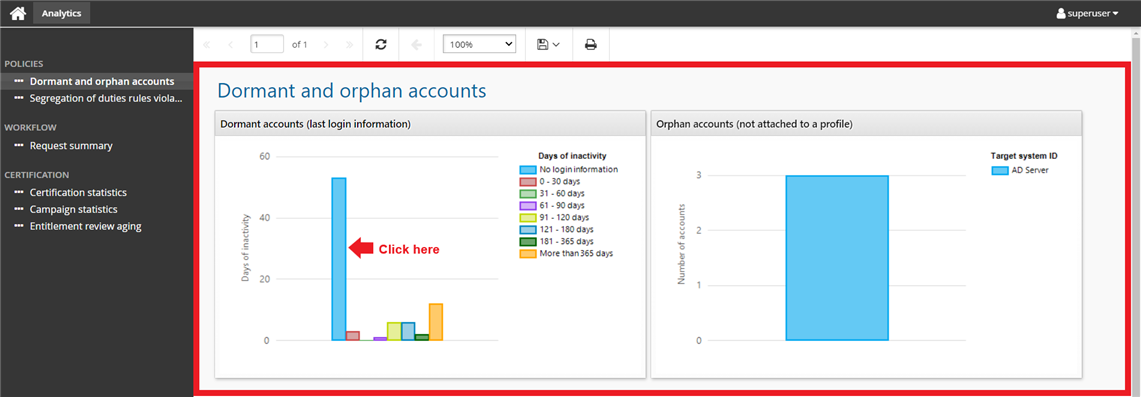
… a more detailed report displaying accounts with no login information is displayed:
For more information about graph behavior see Using graphs within reports .
Exporting reports
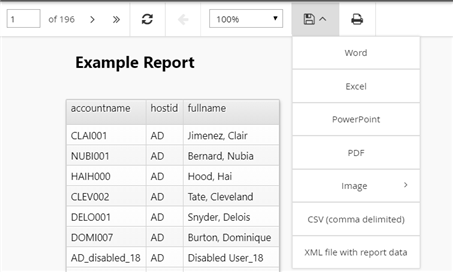
Clicking on the export icon provides the option to export the selected report to the following formats:
Word
Excel
PowerPoint
PDF
Image - bmp, emf, gif, jpeg, png and tif
CSV
XML file with report data
Options
This section describes behaviors you can set globally for the Analytics app.
Navigate to Manage the system > Maintenance > System variables to set the following variables:
CUSTOM ANALYTIC CATEGORIES can be used to display new categories in the Analytics panel.
Sub folders under the ReportItems folder on the SSRS server are considered categories from the Analytics app’s perspective.
A report that is created on the SSRS server and not located in a folder under the ReportItems folder on the same SSRS server will not be shown in the Analytics panel.
If the option is left empty you will see default analytics folders and their reports.
A non-empty sub folder under the ReportItems folder created on the SSRS server and not entered here will not be displayed in the Analytics panel.
If a category is entered here, the category will not appear in the Analytics panel and will not exist on the SSRS server. You must create a sub folder with the same name under the ReportItems folder on the SSRS server.
VIEW ANALYTICS PLUGIN and the analytics policy component hid_policy_analytics_filter can be used to filter the analytics panel by showing or hiding categories and reports.
The component is installed with Bravura Security Fabric by default, along with a sample plugin,
plugin_analyticsfilter.py.See Components for more information.