Create a custom analytics report
This use case demonstrates how to create a new category, to create a paginated report and add that report to the newly created category. In short, to create a custom analytics category and report you must:
Create a category for the Analytics app
Build the report dataset using Microsoft’s Report Builder.
Design the report appearance.
Check that the report appears in the Analytics app.
See below for detailed steps.
Create a category for the Analytics app
To create a report category:
Click Manage the system > Maintenance > System variables.
Add a new category to CUSTOM ANALYTIC CATEGORIES.

Click Update.
Navigate to the <instance>\ReportItems folder and create a folder with the same name as the new category.
Sign into the report server portal.
The URL is in the following format:
http://<servername><port>/Reports/browse/<report_folder_id>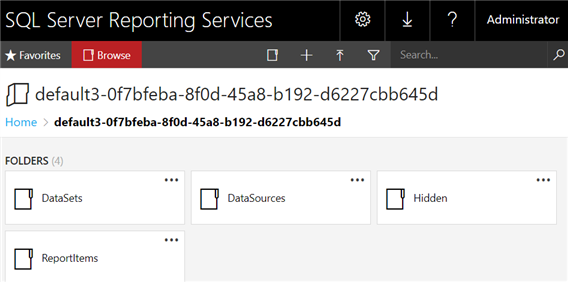
Open the ReportItems folder.
Click New > Folder.
Name the folder the same name as the new category.
Build the report on the report server
From the report server portal, click New > Paginated Report.
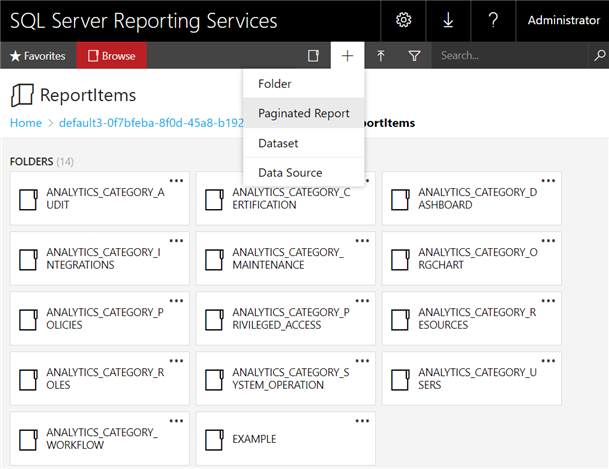
If Report Builder is not installed yet, download and install it.
Click Open Microsoft Report Builder.
Click Blank Report.
Right mouse click on Data Sources and click Add Data Source....
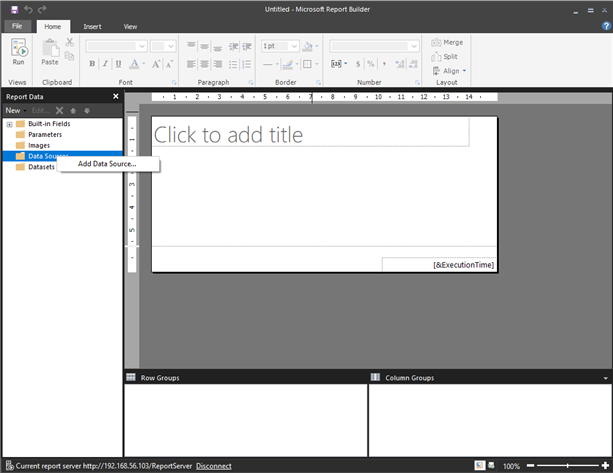
Use the default name
DataSource1or change it to a different name.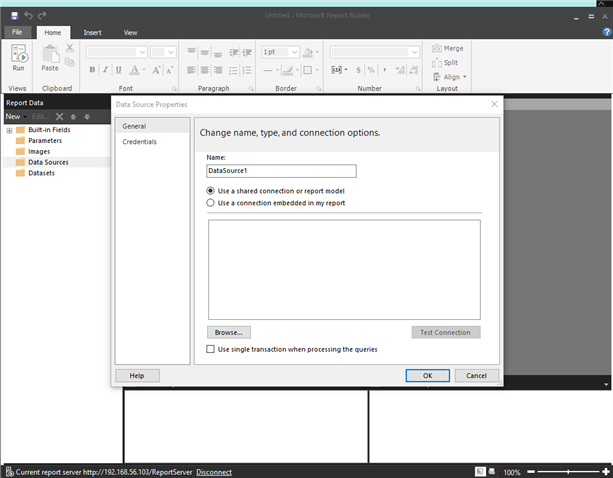
Click Browse and open the <report_folder_id>.
Open the DataSources folder.
Double click idmsuite.
Click Test Connection to ensure the connection is successful.
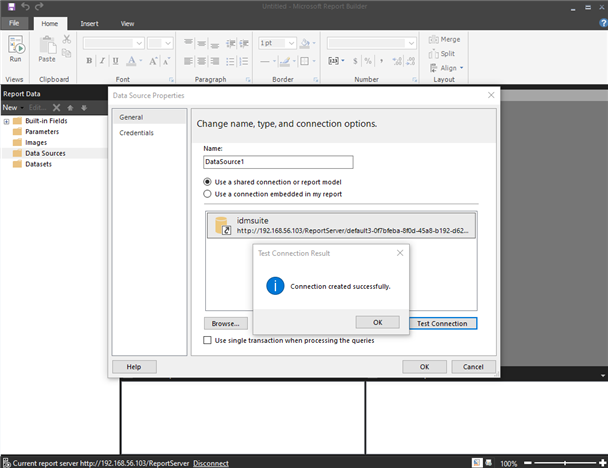
Click OK to close the window.
Click OK again.
Right mouse click on Datasets and select Add Dataset... .
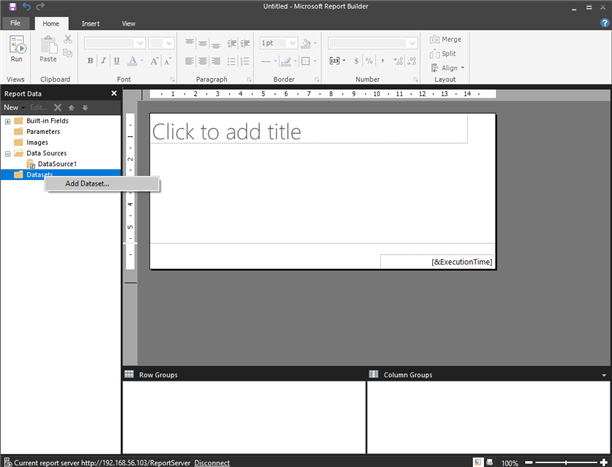
Use the default name or change it to a different name.
Select the radio button Use a dataset embedded in my report.
Select the data source you previously added from the drop down menu in Data source.
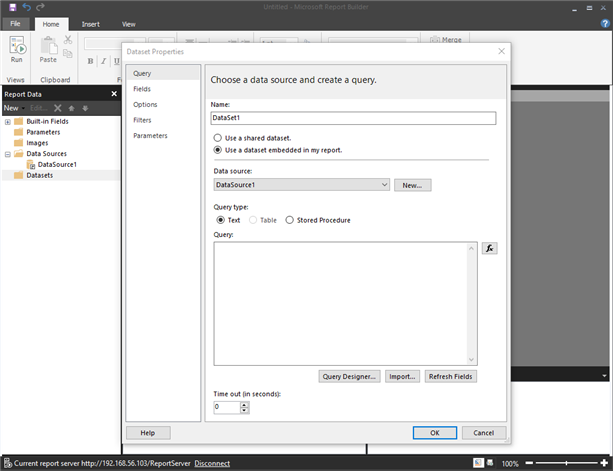
Click Query Designer....
Enter the report database user’s password.
Click OK.
Expand the database view in the left column to open Views.
Select account.
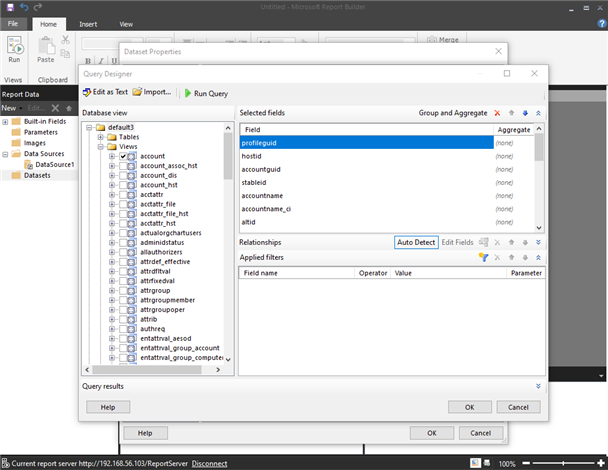
Click OK.
Click OK again.
The dataset is created.
Design the report
To finalize the design of the port using Report Builder:
Click Insert > Insert Table.
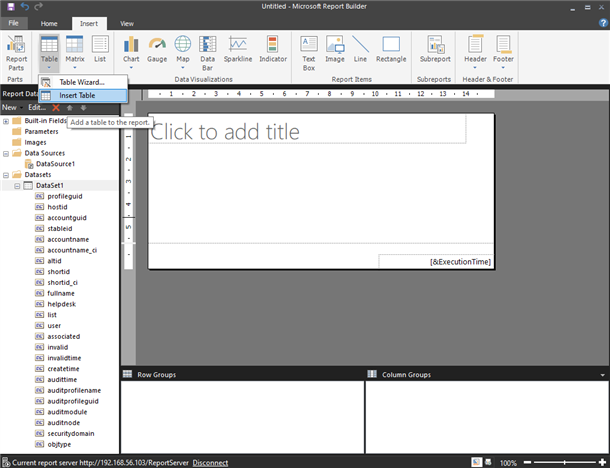
Click anywhere in the blank report to add the table.
A default table of three rows and three columns is inserted into the blank report.
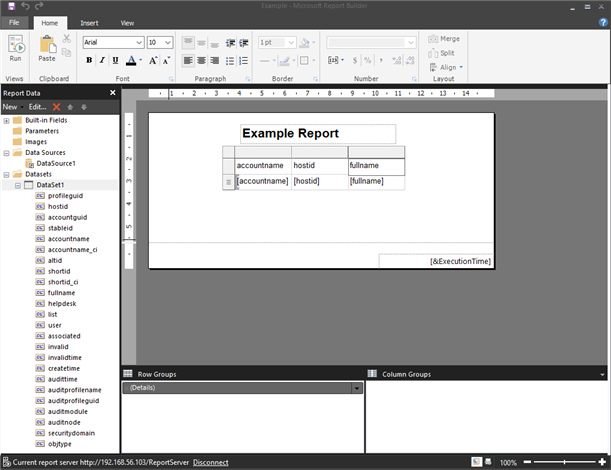
Move the cursor to the right edge of the rectangle box in the third row, first column.
A drop-down list is displayed.
Select accountname.
Move to the next cell and select hostid.
Select fullname in the last cell.
Give the report a title.
Click File > Save.
Save the report under the report folder ReportItems\Example on the report server.
Click Run to see the rendered report.
The report is rendered and displayed:
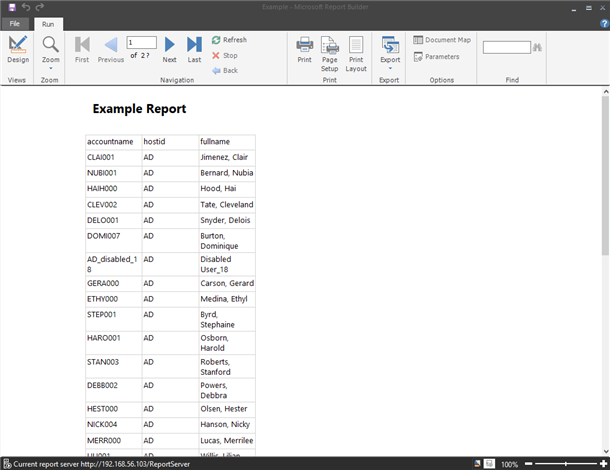
Click Design to go back to edit mode.
Check the Analytics app
To check that the report appears correctly in the Analytics app:
Log in to Front-end (PSF).
Click Analytics.
View the new report in the Analytics app.