Managing and using reports
The following sections show you how to manage and use Bravura Security Fabric built-in reports using the Manage reports (RPT) module, and how to create custom reports.
Getting started
Requirements
Users require the "Manage reports" administrative right in order to access the Manage reports (RPT) module. They can be added to the REPORT_READERS administrator group to be granted this right. Membership criteria is defined by the _REPORT_READERS_ user class. Some reports require additional rights.
If you want to deliver reports by email, you must first set up email notification.
In order to use report output to issue pre-defined requests, configure at least one pre-defined request and:
Make it accessible from reports.
Provide users who can run reports with the appropriate access control settings to submit the request.
Navigation steps
You generate new reports or view previously saved reports using the Manage reports (RPT) module. From the Bravura Security Fabric main menu, click Manage reports .
From here, you can:
Best practice
Schedule reports to calculate the following metrics, weekly, and email them to the product owner:
Users in the system
Users with enrolled profiles
Users who have been invited to enroll but have not done so
New enrollments
New enrollments
Passwords successfully reset
Failed password reset attempts
Unlocked filesystems
Cleared token PINs
Intruder lockouts
Successful authentications, broken down by method (authentication chain)
Running reports
Click below to view a demonstration of running and saving the configuration for a one-time report and scheduling and viewing a regular (periodic) report.
You can run reports with various options to view, save, email, or export the output. To run and save a new report:
Click Manage reports > Reports.
Bravura Security Fabric generates a list of available reports. If this is the first time that you have visited the page, this process may take several seconds.
Select a report category.
Reports belonging to that category are displayed.
Select the report that you want to run.
Optional: Specify your search criteria if you don’t want to see all results.
You can use wildcards as search criteria in many text fields. Available options are described in the sections that follow.
Optional: Configure Display options.
For example select Hide repeating cell values for large data sets.
Optional: If you want to email the report, configure Email report settings.
Email should not be used for saving long reports. If the report size is likely to be larger than 102MB, consider sharing the report by saving to disk or UNC share (next two options).
Optional: If you want to save the report on the Bravura Security Fabric server, configure settings to Save configuration and output on server.
Saving large report files to the drive or partition where the product is installed is not recommended, as it can decrease the available space required by the application. Consider using a UNC share instead (next option)
Optional: if you want completed reports saved to another server, configure settings to Export report output.
Click Run at the bottom of the form to see a report.
When running a report, you may need to click Refresh to reload the page and display the results. You can also click Cancel to cancel the running report. If canceled, a partial report may be displayed.
When Bravura Identity or Bravura Privilege is licensed, you can now use report output to submit pre-defined requests .
If an attribute is encrypted, its value will be masked in report output and the attribute will not present in search criteria options.
When the report has been run, you have several options for displaying the data.
Option | Description |
|---|---|
Visible columns | A drop-down list of the available columns that can be displayed. |
Items per page | The number of items to be displayed in the table. Default is 10 items. |
Highlight | Will highlight text in the table that has been typed. |
Hide repeating cell values | When a large data set is generated, this will help reduce data to be more easily read. |
Default ordering | Will return the table to the default sort ordering. |
You can sort data by clicking a column header to sort the column in ascending or descending order. Only one column can be sorted at a time. Return to the default sorting can be done at anytime by selecting the Default ordering option.
Sorting data only applies to the report output in the web user interface. The sorting is not preserved when the report is saved or sent in an email.
Ensure the email configuration is successfully tested and working. If the size of the report exceeds 10MB, then the report is not sent. Instead, an email message is sent which informs the recipient that the report was too large, and that they may want to change the search criteria to generate a smaller file size. This limitation is hard-coded, not configurable, and some SMTP servers will have a smaller attachment or global email body limit, causing such large email reports to fail to reach their destination even if they leave the Bravura Security Fabric server.
Option | Description |
|---|---|
To | Type comma-separated email addresses to which to send the report and the report selection criteria. Alternatively, type %RECIPIENT_EMAIL% to use that value. Note: If you need to use more than one address in the To, CC or BCC fields, ensure they are separated with just a comma, not comma-space, or the email gateway may not send to all addresses listed. See the SMTP RFC for details. |
Cc | If required, type comma-separated email addresses to which to send a carbon copy of the report. Alternatively, type %RECIPIENT_EMAIL% to use that value. |
Bcc | If required, type comma-separated email addresses to which to send a blind carbon copy of the report. Alternatively, type %RECIPIENT_EMAIL% to use that value. |
Subject | Type a subject for the email. |
Message | Type a message for the body of the email. |
Attachment type | Select the export format: CSV, HTML, or PDF. |
The values in this section are overwritten when scheduling a report.
Option | Description |
|---|---|
Saved report name | Type the name to be used for the downloadable file. You can view the saved report in Manage reports > Saved reports. |
Expiry days | Specify expiry period for the saved reports in days. The value must be between 1 and 999. The default value is 60. You can modify the default using the SAVED REPORTS EXPIRY DAYS setting on the Manage the system > Modules > Manage reports (RPT) menu. |
Never expire | Use this to make the saved report never expire. Expiry days field is hidden when this option is checked. |
Notes | Type notes to be saved with the report. |
Option | Description |
|---|---|
Network path (UNC) | Type a UNC path destination for the exported report. The path must be to a target system. It can map to a real FS share (e.g. \\server\some_path\share_1) or a domain DFS share (e.g. \\domain\namespace\share_1). If you do not want to list users or perform other operations on the system you want to export to, you can set up a NULL type target system simply to store the administrator credentials. In this case, ensure that the listing options are disabled for the target system. If you are mapping to a network drive ensure you enter the credentials using down-level logon name format; for example, DOMAIN\UserName. |
File name | Type a name for the exported report. |
File type | Select the export report format: CSV, HTML, or PDF. |
Target system to use for credentials | Search for and select the target system ID for credentials. |
Administrator ID | Select an administrator ID from the target system. |
Using macros to substitute text
Macros can be used to substitute text when the report runs. The macros must be enclosed in angle brackets <> and are case sensitive.
Macros can be used in the following fields:
Email subject
Email message
Saved report name
Network path (UNC)
File name
Notes
Requester notes
Below is a list of available macros:
Macro | Example substitution |
|---|---|
<SERVER> | bravura-1 |
<USER> | reporter00 |
<DATETIME> | 2015-06-18 01-22 |
<RUNTIME> | 2015-06-18 01-22 |
<DATE> | 2015-06-18 |
<TIME> | 01-22 |
<DAY> | 17 |
<MONTH> | 03 |
<YEAR> | 2015 |
<CC> | 20 |
<YY> | 15 |
<MM> | 03 |
<DD> | 17 |
<HH> | 14 |
<hh> | 02PM |
<mm> | 57 |
<ss> | 04 |
Scheduling reports
You can schedule a report to run at a later time, with options to email or export the output. The scheduled job can be made recurring, and can be modified at any time.
Click below to view a demonstration.
To schedule a report:
Click Manage reports > Reports.
Bravura Security Fabric generates a list of available reports. If this is the first time that you have visited the page, this process may take several seconds.
Select a report category.
Reports belonging to that category are displayed.
Select the report that you want to run.
Optional: Specify your search criteria if you don't want to see all results.
You can use wildcards as search criteria in many text fields. Available options are described in the sections that follow.
Optional: Configure Display options.
For example select Hide repeating cell values for large data sets.
Optional: Configure Email report settings if you want to email the report.
Optional: Configure settings to Save configuration and output on server if you want to save the report on the Bravura Security Fabric server.
Optional: Configure settings to Export report output if you want completed reports saved to another server.
Configure options to schedule the report.
Click Schedule to create the scheduled job.
When the report has been run, you have several options for displaying the data.
Option | Description |
|---|---|
Visible columns | A drop-down list of the available columns that can be displayed. |
Items per page | The number of items to be displayed in the table. Default is 10 items. |
Highlight | Will highlight text in the table that has been typed. |
Hide repeating cell values | When a large data set is generated, this will help reduce data to be more easily read. |
Default ordering | Will return the table to the default sort ordering. |
You can sort data by clicking a column header to sort the column in ascending or descending order. Only one column can be sorted at a time. Return to the default sorting can be done at anytime by selecting the Default ordering option.
Sorting data only applies to the report output in the web user interface. The sorting is not preserved when the report is saved or sent in an email.
Ensure the email configuration is successfully tested and working. If the size of the report exceeds 10MB, then the report is not sent. Instead, an email message is sent which informs the recipient that the report was too large, and that they may want to change the search criteria to generate a smaller file size. This limitation is hard-coded, not configurable, and some SMTP servers will have a smaller attachment or global email body limit, causing such large email reports to fail to reach their destination even if they leave the Bravura Security Fabric server.
Option | Description |
|---|---|
To | Type comma-separated email addresses to which to send the report and the report selection criteria. Alternatively, type %RECIPIENT_EMAIL% to use that value. Note: If you need to use more than one address in the To, CC or BCC fields, ensure they are separated with just a comma, not comma-space, or the email gateway may not send to all addresses listed. See the SMTP RFC for details. |
Cc | If required, type comma-separated email addresses to which to send a carbon copy of the report. Alternatively, type %RECIPIENT_EMAIL% to use that value. |
Bcc | If required, type comma-separated email addresses to which to send a blind carbon copy of the report. Alternatively, type %RECIPIENT_EMAIL% to use that value. |
Subject | Type a subject for the email. |
Message | Type a message for the body of the email. |
Attachment type | Select the export format: CSV, HTML, or PDF. |
The values in this section are overwritten when scheduling a report.
Option | Description |
|---|---|
Saved report name | Type the name to be used for the downloadable file. You can view the saved report in Manage reports > Saved reports. |
Expiry days | Specify expiry period for the saved reports in days. The value must be between 1 and 999. The default value is 60. You can modify the default using the SAVED REPORTS EXPIRY DAYS setting on the Manage the system > Modules > Manage reports (RPT) menu. |
Never expire | Use this to make the saved report never expire. Expiry days field is hidden when this option is checked. |
Notes | Type notes to be saved with the report. |
Option | Description |
|---|---|
Network path (UNC) | Type a UNC path destination for the exported report. The path must be to a target system. It can map to a real FS share (e.g. \\server\some_path\share_1) or a domain DFS share (e.g. \\domain\namespace\share_1). If you do not want to list users or perform other operations on the system you want to export to, you can set up a NULL type target system simply to store the administrator credentials. In this case, ensure that the listing options are disabled for the target system. If you are mapping to a network drive ensure you enter the credentials using down-level logon name format; for example, DOMAIN\UserName. |
File name | Type a name for the exported report. |
File type | Select the export report format: CSV, HTML, or PDF. |
Target system to use for credentials | Search for and select the target system ID for credentials. |
Administrator ID | Select an administrator ID from the target system. |
Option | Description |
|---|---|
Job | Type an ID for this scheduled report. When a scheduled report is run, you can view it in the Saved reports list. The report name is <job> appended with the timestamp. |
Email address to send scheduled report warnings to | Type an email address to receive notification of problems with scheduled reports. If not specified the RECIPIENT EMAIL address is used. |
Enabled | Select this when you are ready to run the report at the next schedule time. |
Expiry days | Specify expiry period to save the report in days. The value must be between 1 and 999. The default value is 60. You can modify the default using the SAVED REPORTS EXPIRY DAYS setting on the Manage the system > Modules > Manage reports (RPT) menu |
Never expire | Use this to make the saved report never expire. Expiry days field is hidden when this option is checked. |
Notes | Type notes to be emailed with the report. |
Job time range | Specify if you want your job to always run, to run for a specific length of time, or for a specific number of iterations by selecting one of the following from the drop-down list:
|
Last day of the month | For monthly to annual schedules, use this setting to avoid missed run times. For example, if you schedule a job quarterly, with a start date of August 31, the next run time after August 31 would be November 31, which does not exist. With this setting enabled, the next round would start on the last day of the month, November 30. |
Repeat type | Select the frequency of the scheduled job using the drop-down list. Depending on the repeat type, set scheduling options:
|
Period mode | For jobs that are repeated quarterly, semi-annually, and annually, choose either: Start date - then Period start date and time Month/week/day - then select the first month, week of the month, and day of the week to perform the task. The Choose the first month to perform this task setting is based on the current calendar year. For example if you set the first month for a quarterly job to January, and the current month is February, the task will start in April. |
Date and time to run / Time to run | All scheduled jobs time to run is local to the server that runs the job. Except for jobs that are run once, the default time to run is set by Manage the system > Modules > Options > DEFAULT SCHEDULED TIME. |
Viewing and modifying scheduled reports
Once a scheduled job is created, you can use the Scheduled reports tab to modify, enable, disable, or delete a scheduled report. You can also view other users' scheduled reports. You cannot remove or modify a pre-defined request that uses the report output from this menu.
When viewing reports, if the DISPLAY TIMEZONE option is enabled, the scheduled time displayed may differ by an hour if the server or the user profile follows Daylight Savings Time and the other does not.
Product upgrades and scheduled reports
Scheduled reports created in a previous version of the product may be affected by limitations after an upgrade. The product stores a version stamp with each scheduled report configuration, and when the stored version does not match the currently installed version, the report is treated as a legacy report.
The following limitations apply to legacy scheduled reports:
The Schedule button is unavailable when viewing a legacy scheduled report. This applies to both the report owner and superusers viewing the report through Other user's scheduled reports. Without this button, the report configuration cannot be modified.
Legacy scheduled reports will continue to run on their existing schedule, but they cannot be edited or rescheduled through the UI.
The UI does not indicate whether a scheduled report is a legacy report. To confirm, check the
idmsuite.logfor an informational message fromrpt.exesimilar to:Info: Archived report version=[12.6.0] does not match current version=[12.7.2]
This behavior is by design. Report configurations from older versions may reference parameters, filters, or internal structures that have changed in the current version. Allowing modification of these configurations could lead to errors or unexpected results. The version check prevents this by making legacy reports read-only.
To resolve this, delete the legacy scheduled report and recreate it in the current version. The new report will have full editing capabilities. You can view the existing report's schedule on the Manage the system > Maintenance > Scheduled jobs page to note its settings before recreating it.
Note
Saved report output from previous versions may also be affected. If a saved report's spool file is missing or unreadable, the report will appear in the saved reports list but its content will not be accessible.
Example: Schedule report on accounts
This example shows you how to run a one-time Accounts report, and then schedule a regular report.
For this example it is assumed that:
Bravura Security Fabric and Connector Pack are installed.
An Active Directory target system is added as a source of profiles.
To view and save a one-time report:
Log in to Bravura Security Fabric as
superuserwith password .Click Manage reports > Reports.
Bravura Security Fabric generates a list of available reports. If this is the first time that you have visited the page, this process may take several seconds.
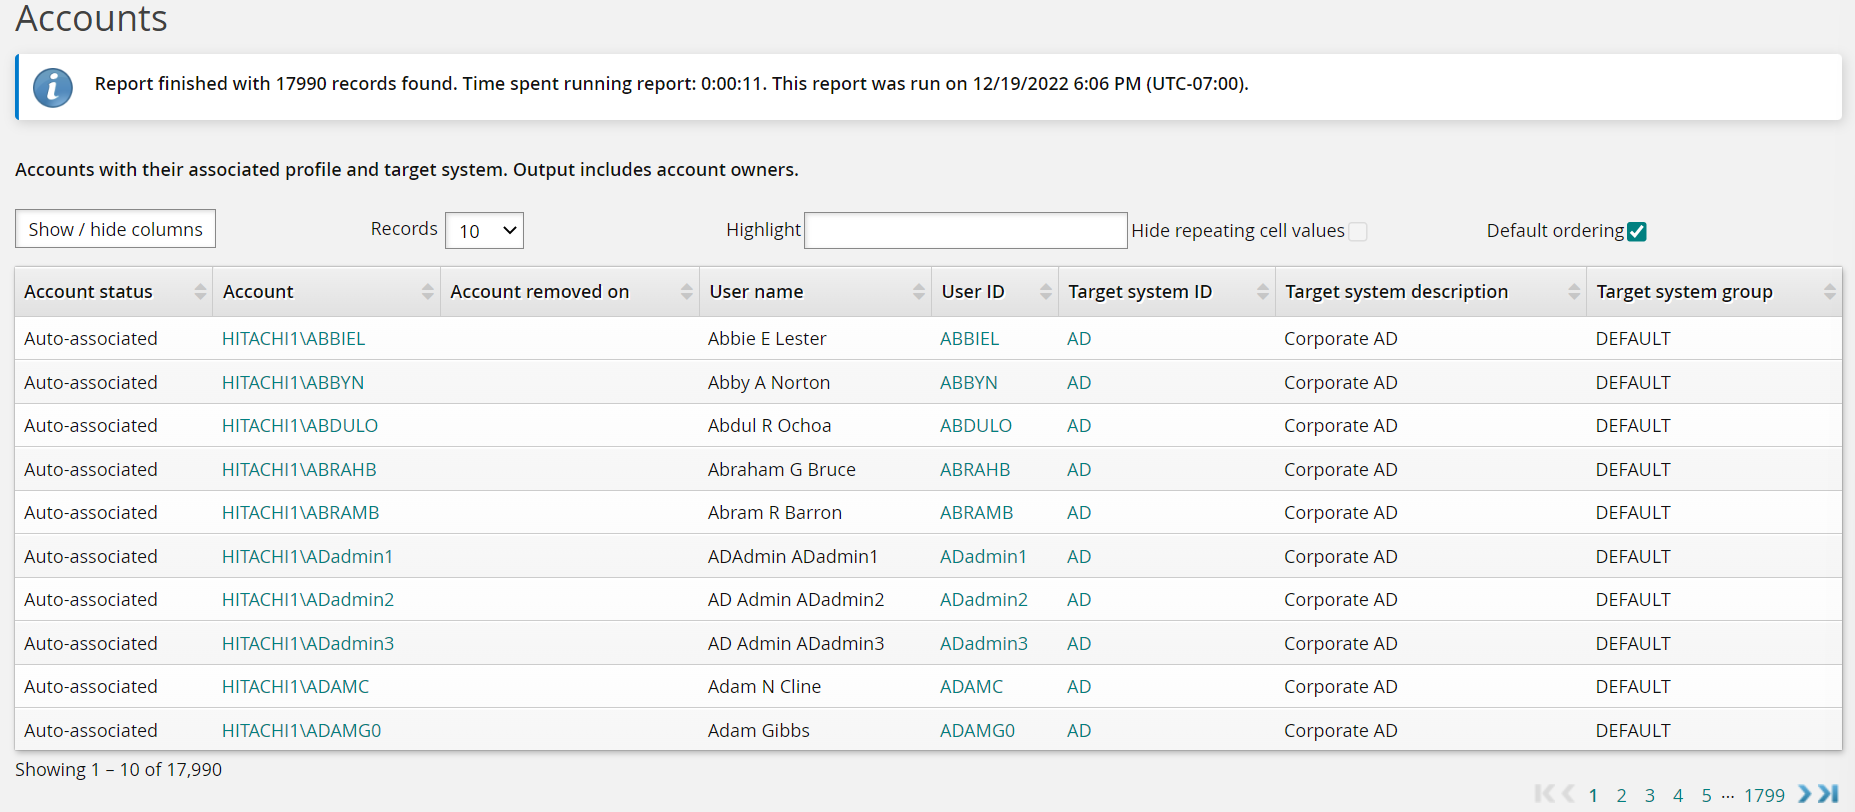
Click Users > Accounts.
Click the search icon
 in the Target system ID field to select checkbox for the AD target system.
Click Select .
Expand the Save configuration and output on server section.
In the Saved report name field, type AD Accounts.
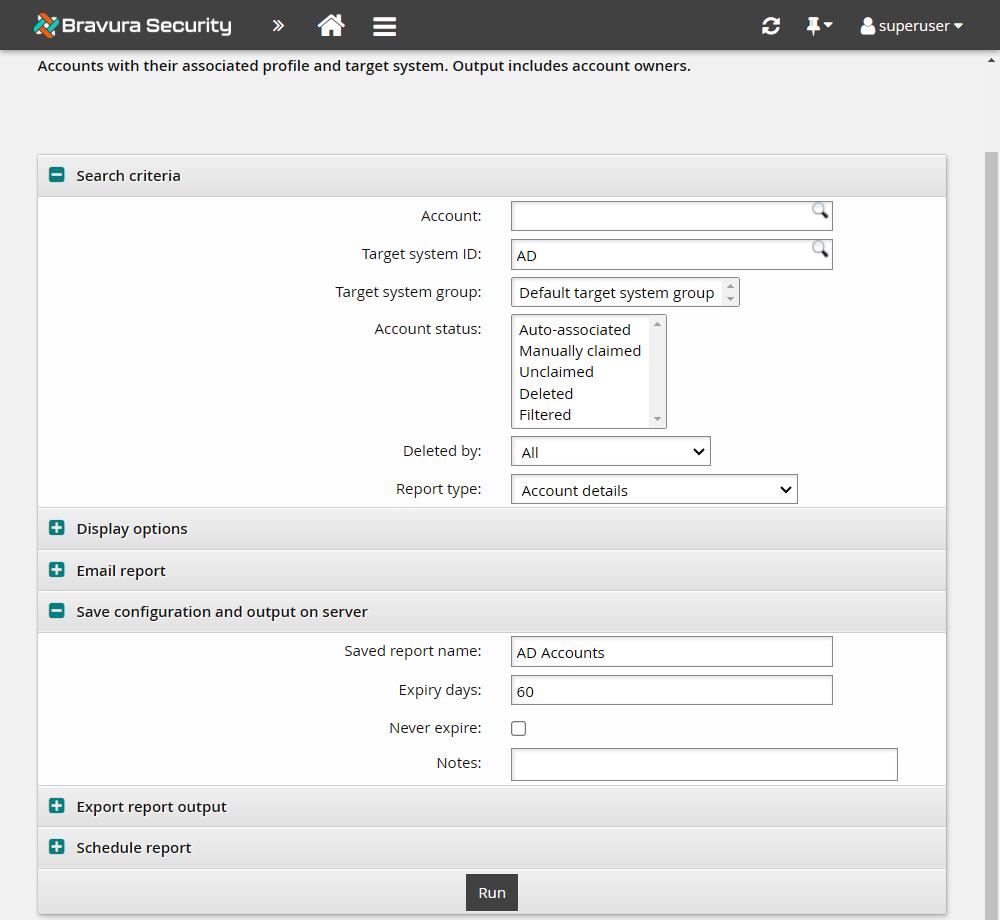
Click Run at the bottom of the form to see the results.
You may need to click Refresh to reload the page and display the results.
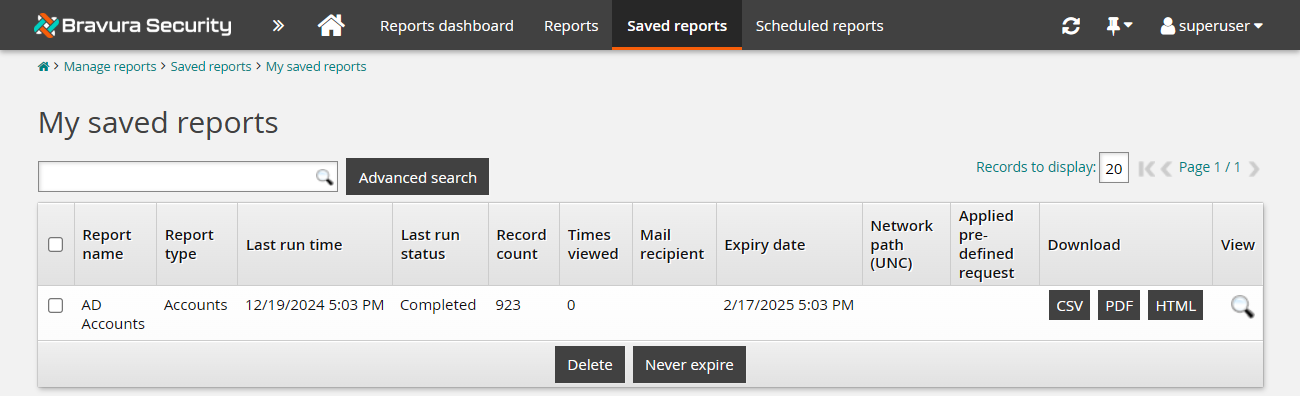
Click the Saved reports tab.
Click My saved reports.
Your report should be listed on the My saved reports page.
To schedule and save a regular report:
Click Manage reports > Reports > Users > Accounts again.
Click the search icon
in the Target system ID field to select the AD target system.Click Select .
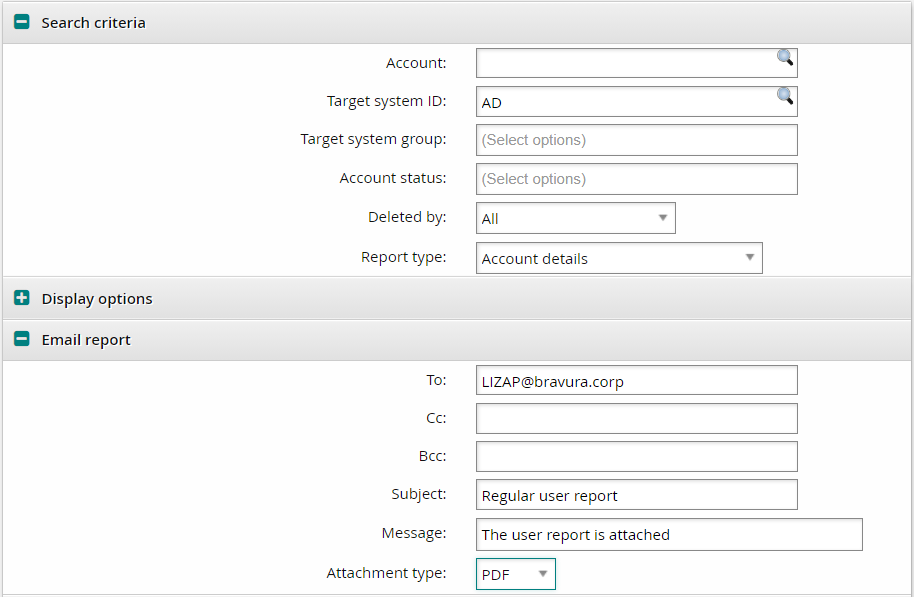
Expand the Email report section.
Enter the following values:
To <user>
Subject Regular user report
Message The user report is attached
Attachment type PDF
Expand the Schedule report section.
In the Job field, type
AD Accounts.Select the Enabled checkbox.
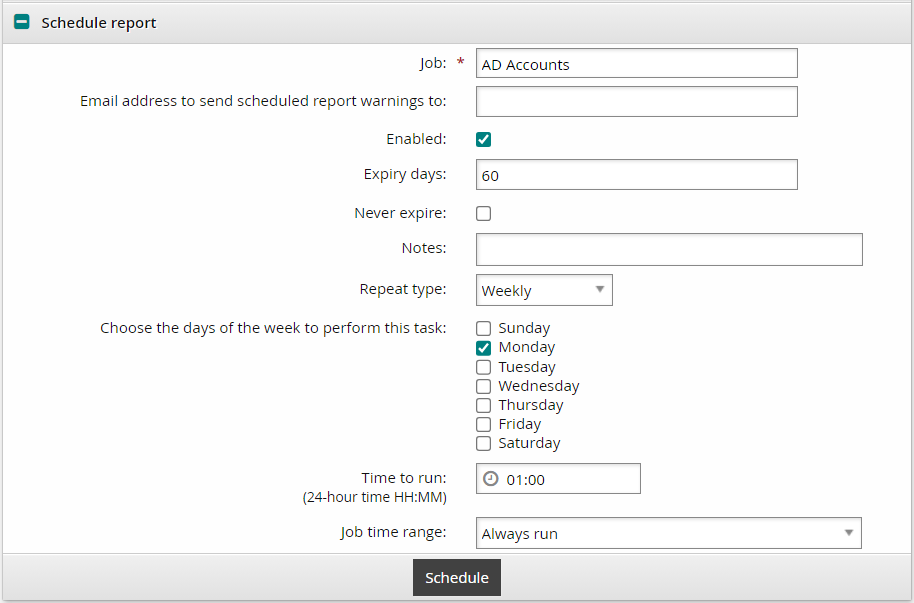
Click Schedule at the bottom of the form.
Click the Scheduled reports tab.
Click My scheduled reports.
Your report should be listed on the page. At the next scheduled runtime, the report will be emailed to <user>.
Once a scheduled job is created, you can use the menu to modify, enable, disable, or delete a scheduled report.
When a scheduled report is run, you can view it in the list. The report name is <Job> appended with the timestamp.
Submitting pre-defined requests using report output
Product license
Applies with a Bravura Identity or Bravura Privilege license.
If you have permission to run a pre-defined request that is set up to use with reports, you can use the report output to issue the request to Bravura Security Fabric ’s workflow engine via the Manage reports (RPT) module. Segments of the report can be submitted to pre-defined requests with iterative submissions. Note that you need to run the report before the request option becomes available.
To use report output to issue a request:
The Submit pre-defined requests using report output section is added to the bottom of the table.
Expand Submit pre-defined requests using report output.
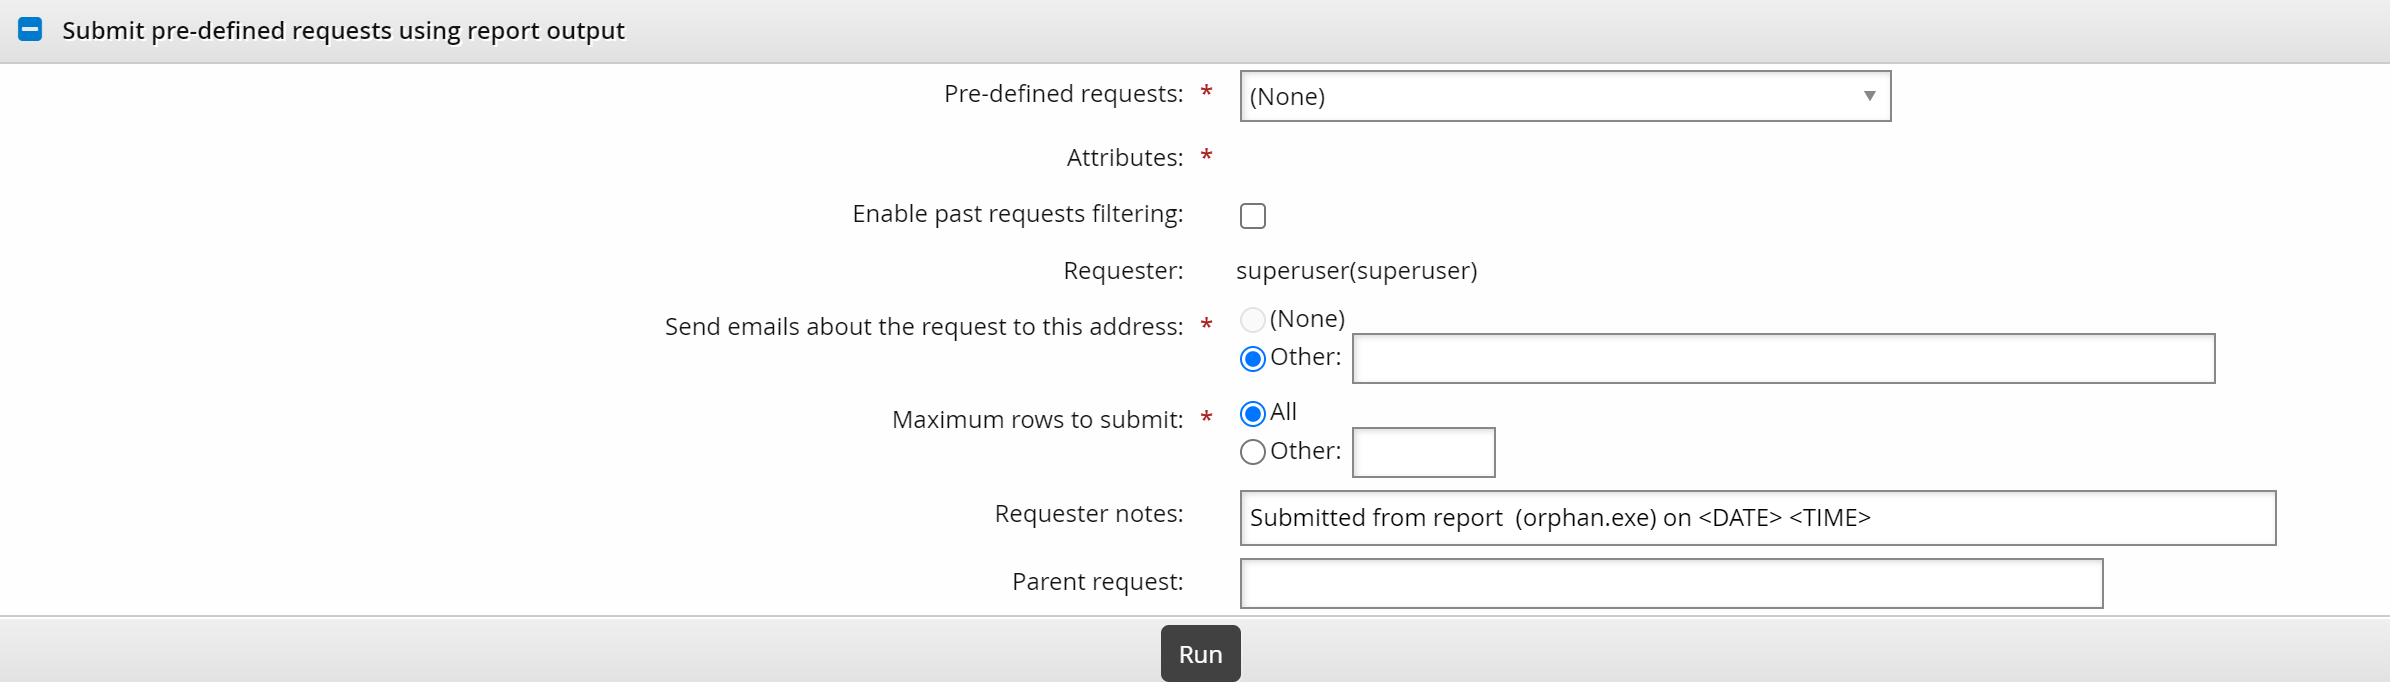
Select one of the Pre-defined requests from the drop-down list.
Bravura Security Fabric adds a magnifying glass icon
next to the request ID. Click this to view information about the pre-defined request. Another icon is added next to the Attributes field.Currently not all types of pre-defined requests are available in reports; these include some pre-defined requests for network resources, and pre-defined requests for existing parent or child groups which contain a required operation of adding a group to or removing a group from another group.
Click the
to configure Attributes.Bravura Security Fabric displays the window.
For user-based requests, enter the Recipient ID, either by mapping it to an ID in the report output, or typing a static profile ID. The recipient ID must match a valid profile ID. Alternatively, you can click
to search for the Recipient ID.Map other attributes to the report output or static values.
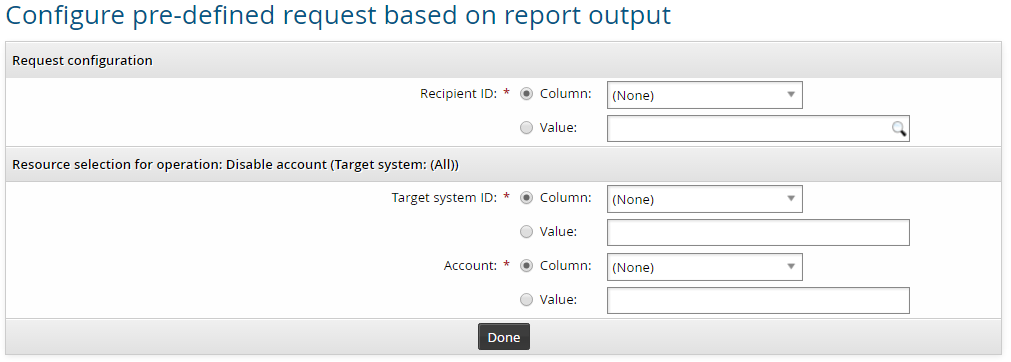
Click Done to return to the report form.
If you want to filter out duplicate requests from previous output, select Enable past request filtering and set the number of days you want filter.
Combine this option with Maximum rows to submit to submit segments of the report output to pre-defined requests with iterative submissions.
Change the Maximum rows to submit option to ’Other’ if you want to test the request from report output, or submit the requests in smaller batches. This option is set to ’All’ by default.
If you specify a number (between 1 and 999), requests will be submitted until the maximum is reached.
If you want notification sent to an address other than the one shown, change the value in Send emails to this address with information about the request.
Type Requester notes as required.
This field allows the use of macros to substitute text when the report runs.
Type the ID of a Parent request as required.
If specified, the parent request will be attached to the pre-defined request when the report runs.
Optional: Configure settings to Schedule report if you want to run the report and submit requests at a later time.
Click:
Schedule for submission if you set up a scheduled job.
The selected pre-defined request cannot be modified or removed from the Scheduled jobs page. Mapped attributes cannot be modified.
Run for submission to submit requests immediately.
Bravura Security Fabric displays a summary of the requests submitted.
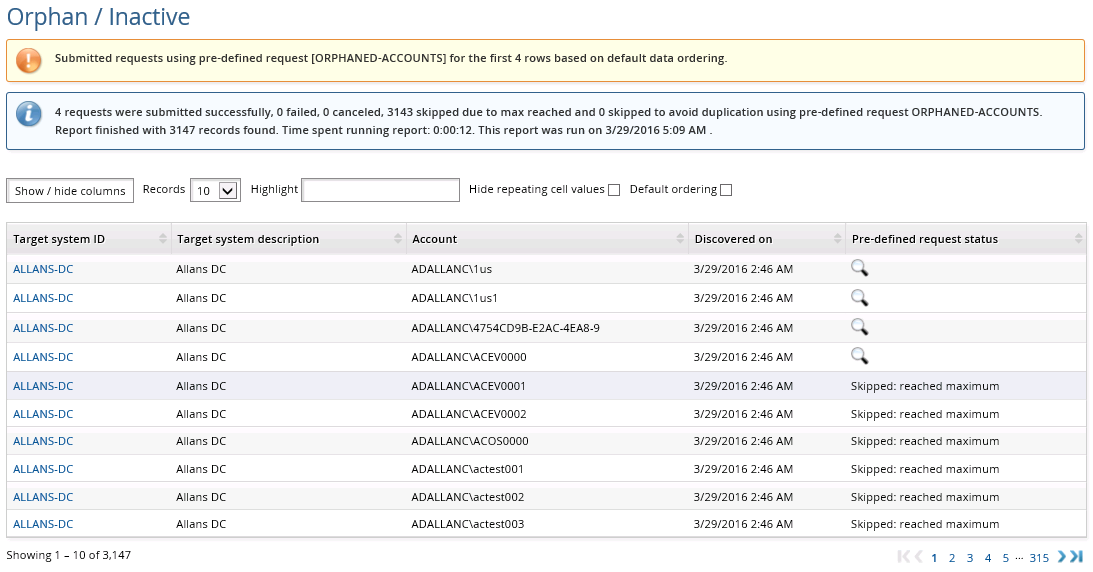
You can click on the info icon
in the Shows the configuration of pre-defined requests column to view the status of each request.
Tracking requests
You can view request status via the Requests link on the Front-end (PSF). You may also be able to cancel or escalate the request, or modify some attributes before the request is authorized.
Using date ranges within reports
Some reports allow you to specify a date range in the search criteria, allowing you to refine the report output.
To specify a date range, you can choose one of the following if it applies to your report:
Use relative date to use a date relative to when report executes
Use selected date to define a specific date range for your report
Use within the last N days to specify the last number of days for the report to search within
Use N or more days ago to specify the number of days ago for the report to begin searching from
Submitted during the last N days to specify a certain number of past days for the report to search within
Use within the next N days to specify a certain number of future days for the report to search within; for example password expiry date, or the end time of a request
When scheduling a report, use a relative date for your date range. This ensures that the date range would be valid when the scheduled report executes.
Choosing Use relative date makes a drop-down list appear, which allows you to select the type of relative date. A relative date is calculated based on the day that the report is executed.
All time value ranges are from 00:00:00 to 23:59:59.
Option | Description |
|---|---|
Current day | The 24 hour period that the report is executed within, from 00:00:00 to 23:59:59. |
Current calendar week | The current seven day period, from Sunday to Saturday, which is calculated from the day the report is created. For example, if the report is run on Tuesday August 3rd, then the date range would be from Sunday August 1st to Saturday August 7th. |
Current month | The current month from beginning to end, determined by the day the report is executed. For example, if the report is run on August 3rd, then the date range would be from August 1st to August 31st. |
Current quarter | The current quarter from the first day of the quarter to the last day of the quarter. For example, if the report is run on August 3rd, then the date range would be from July 1st to September 30th. |
Current year | The current year based on when the report is executed. For example, if the report is run on August 3rd, 2010, then the date range would be 2010-01-01 to 2010-12-31. |
Previous day | The previous 24 hour period, from 00:00:00 to 23:59:59, determined by the time the report is executed. |
Previous calendar week | The previous seven day period, from Sunday to Saturday, which is calculated from the day the report is created. For example, if the report is run on Tuesday August 3rd, then the date range would be from Sunday July 25th to Saturday July 31st. |
Previous month | The previous month from beginning to end, determined by the day the report is executed. For example, if the report is run on August 3rd, then the date range would be from July 1st to July 31st. |
Previous quarter | The previous quarter from the first day of the quarter to the last day of the quarter. For example, if the report is run on August 3rd, then the date range would be from April 1st to June 30th. |
Previous year | The previous year based on when the report is executed. For example, if the report is run on August 3rd, 2010, then the date range would be 2009-01-01 to 2009-12-31. |
You can define a specific date range for your report. The first date/time field selects the earliest start time to include, and the second selects the latest.
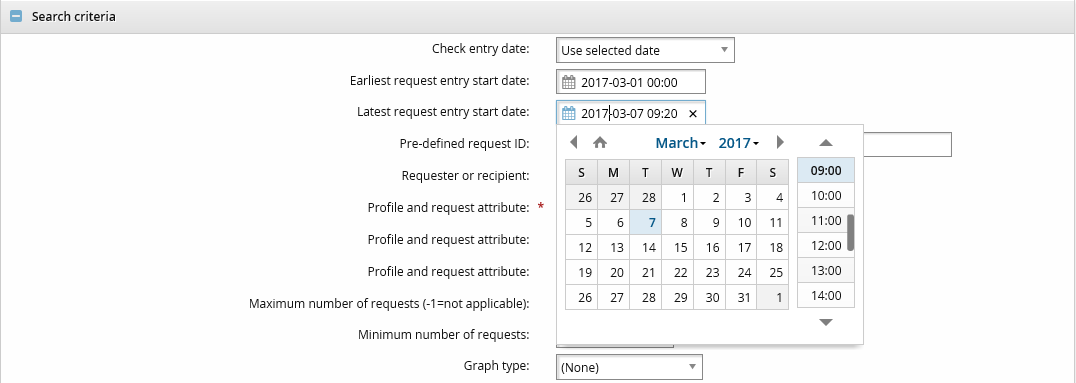
The start time is the time that the report was executed. To set a selected date range:
Click the upper date/time field to specify the start date and hour.
Type a start time in HH:MM format if you do not want to start on the hour.
Click the lower date/time field to specify the end date and hour.
Type an end time in HH:MM format if you do not want to start on the hour.
The allowed years range from 1970 to 2038.
Using graphs within reports
Some reports have an option to summarize information in a graph format. You can choose this option by selecting the <Report name> summary option and then specifying a Graph type.
JavaScript must be enabled for the graphs to be visible.
There are four graph types in Bravura Security Fabric , two of which are alike:
For all graph types, individual sets of information are color-coded. Hovering over an element of the graph displays its name and associated value.
The sections of the graph are also identified in the label box. Hovering over a label highlights the corresponding section on the graph. You can filter out unwanted data by clicking on the colors in the label box.
If a report supports multiple graph types, you can switch between types, without having to run the report again, by clicking a radio button below the graph.
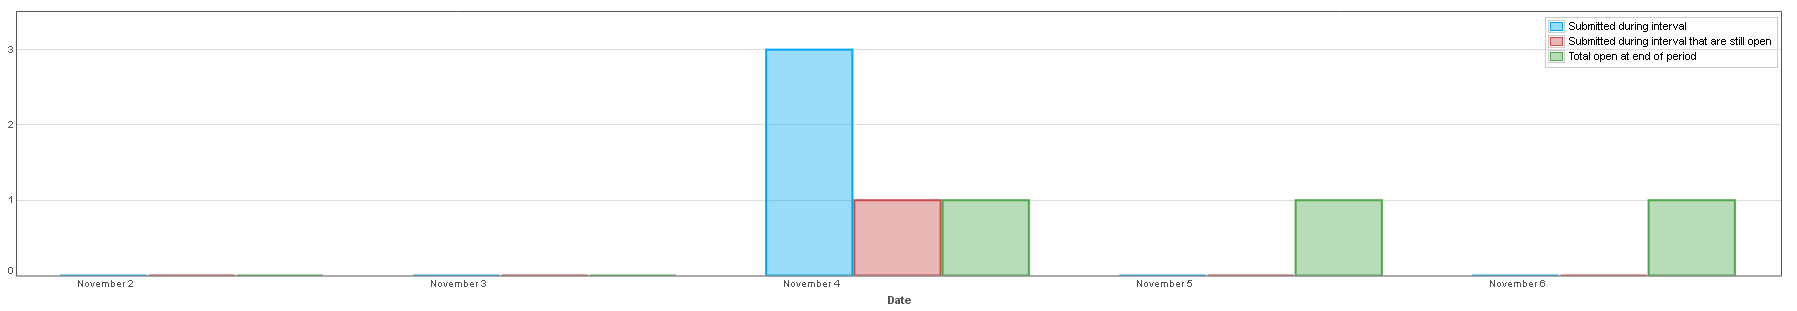
Horizontal and vertical bar charts
The horizontal and vertical bar chart types display information in opaque bars that stretch across the screen.
The chart has two axes, one of which divides the subsections of the report output into bars and the other of which displays the associated amount.
The vertical bar chart type often represents trends on a timeline. In this case, each individual unit of time has its own set of bars. If available, you can use a Reporting time interval option to set the unit of time to sort the timeline. Navigate the timeline using the mouse.
A horizontal bar chart may have a Number of rows for graph setting which limits the number of rows displayed within the graph. To reduce clutter on the page, there is a hard limit of 100 rows to this setting.
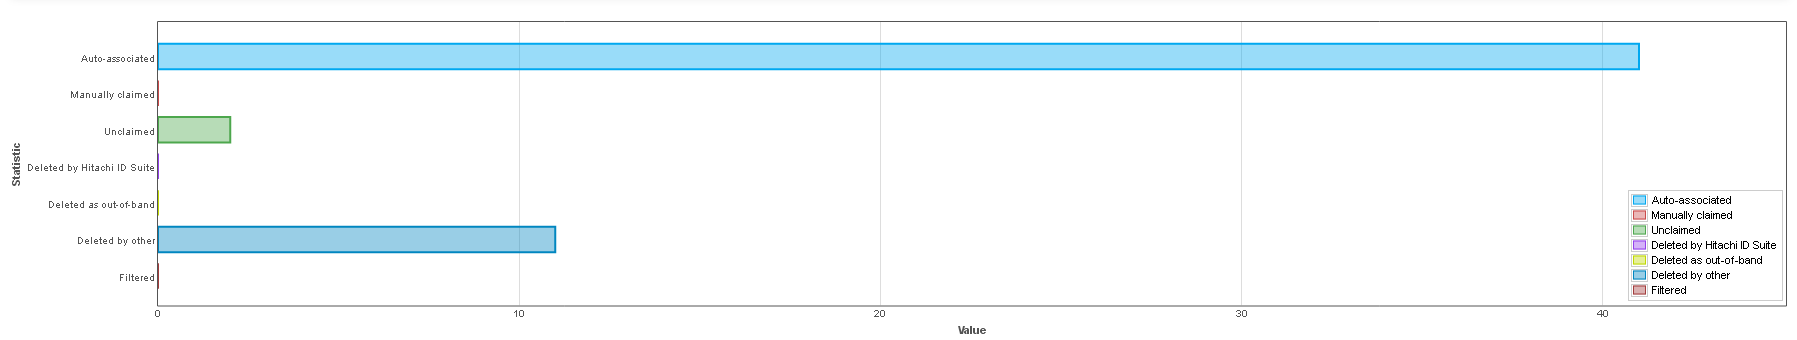
For horizontal or vertical bar charts you can click on an individual bar to view detailed data in a pop-up window.
Pie chart
The pie chart presents a summarized report output within a circle, with each data subsection having its own sector proportional to the amount it represents. The specific percentages for each sector are displayed next to it.
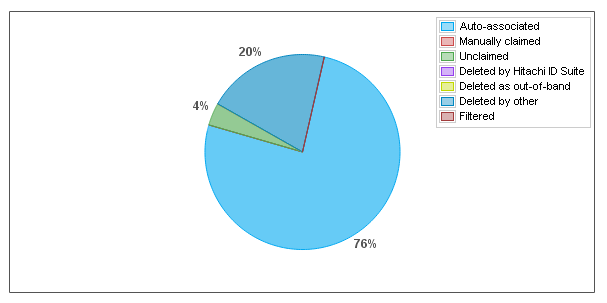
For pie chart graphs, you can open the drill-down window by clicking on the colored sectors of the pie chart.
You can click on an individual sector to view detailed data in a pop-up window.
Line chart
The line chart graph type displays information from the report using nodes, which are linked together using lines.
This graph type is used to represent trends on a timeline. Each individual unit of time has multiple nodes on the graph. If available, you can set the unit of time to sort the timeline using the Reporting time interval option. Navigate the timeline using the mouse.
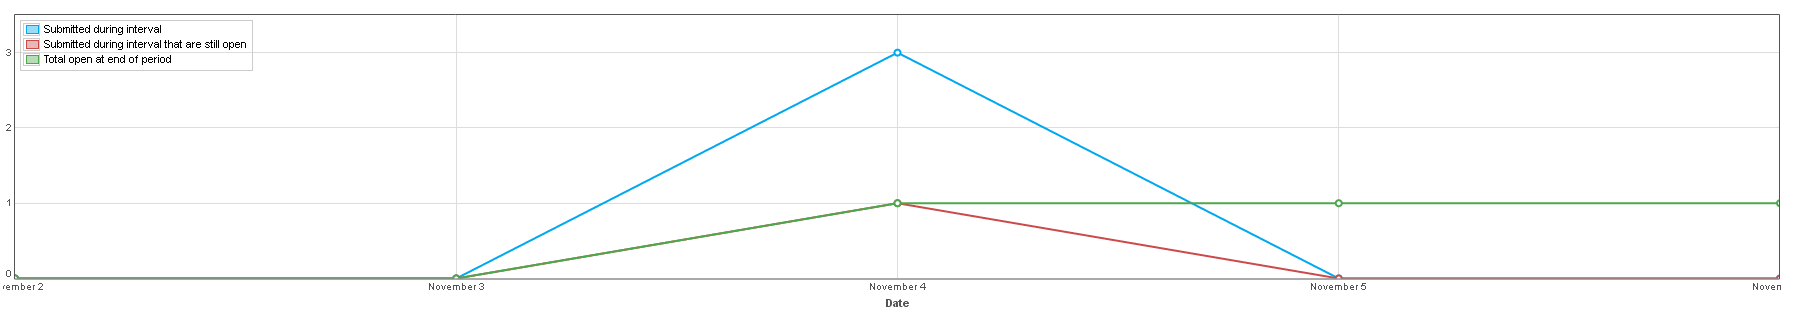
For line chart graphs, you can view detailed data in a pop-up window by clicking the nodes on the chart.
Since there are often multiple data lines in one line chart, at times the nodes on the lines will intersect. In this case, clicking on the node opens a drop-down menu that allows you to choose the line for which you want to view detailed data.
View data in drill-down reports
You can get a more in-depth representation of the data in any graph by clicking on an area in the graph or on any row within the table below the graph. This opens a pop-up "drill-down" window that tables data from a specific section of the graph.
Each graph type has a slightly different way of opening the drill-down window which is covered in their respective sections.
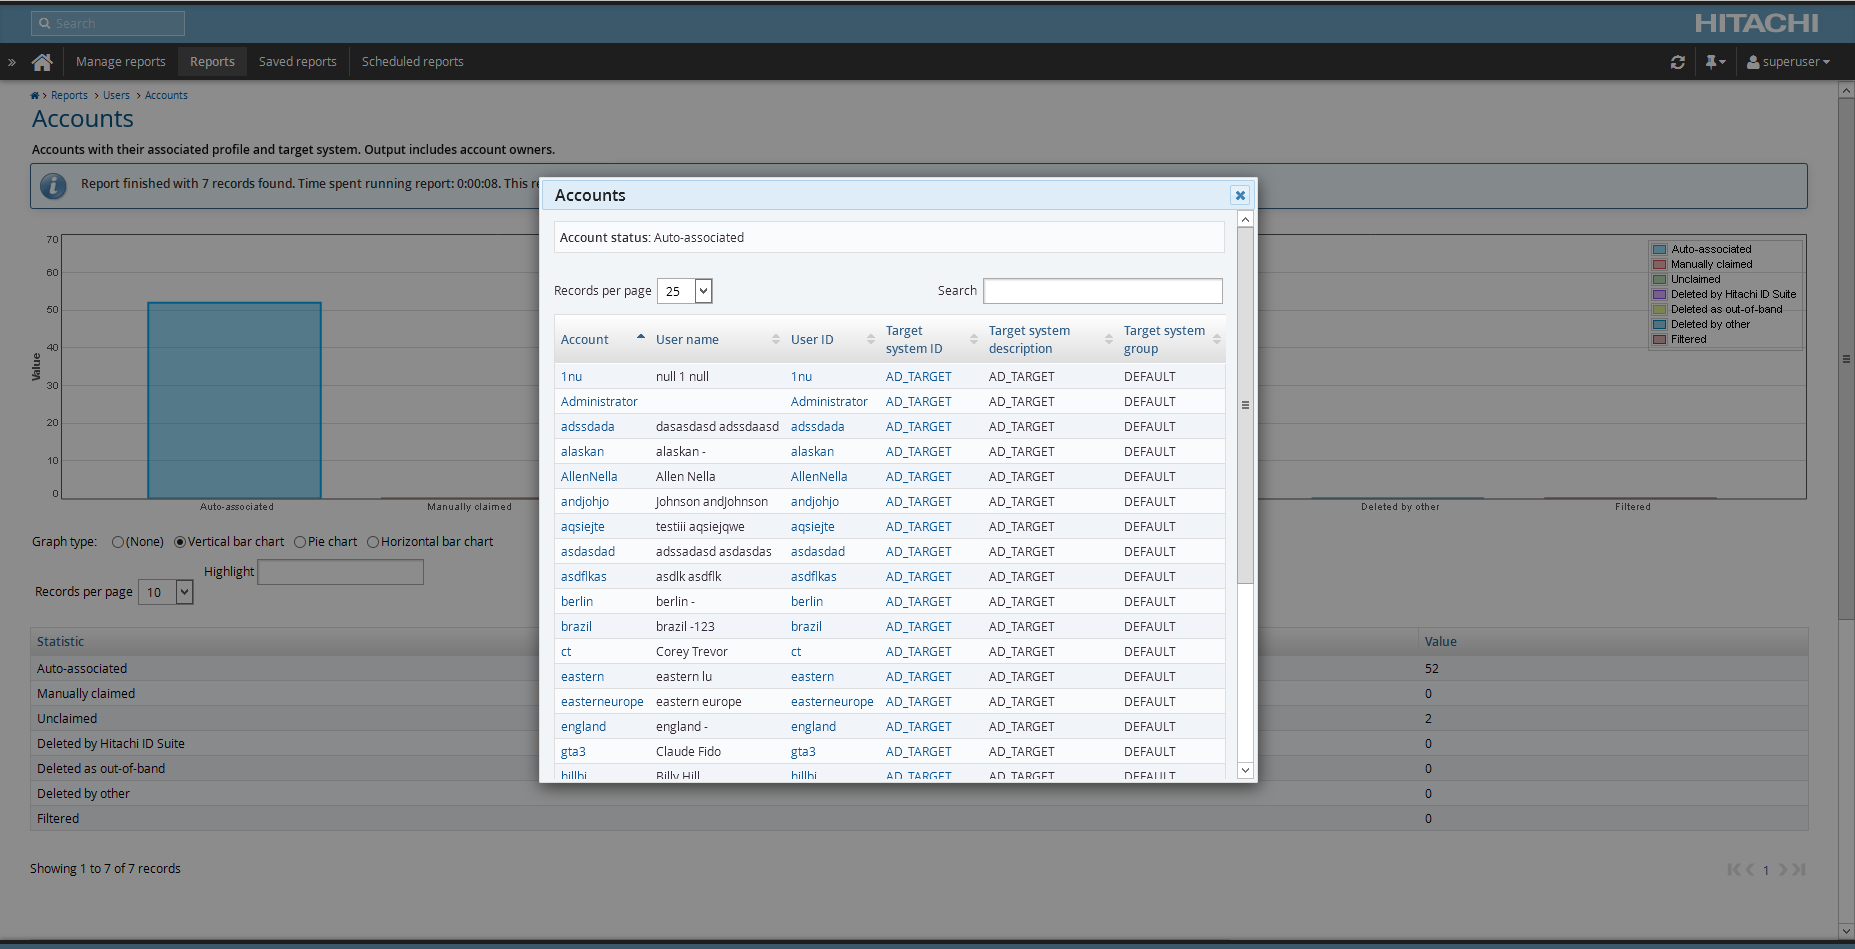
A basic search box within the window allows you to filter data within the table.
Unlike other Bravura Security Fabric pop-up windows, the graph drill-down window can be resized and moved around the screen to your liking.
To leave the drill-down window, either click the close icon on the top right-hand side of the window or press [Esc] .
Using search pages within reports
Some reports have fields that allow you to access search pages for certain objects. The search pages for these objects are similar to the standard search pages; however, there are some differences.
Some search pages use an older style user interface. For example, the search page for target systems in the Users > Accounts report uses the older style, while the search page for accounts uses the newer, standard style. The differences are noted in the rest of this section.
Basic searching
To access a search page for a particular report field, click the search icon in that field.
To narrow down the list of objects on a search page, type a word or phrase to search for in the search field, then click the search button, or on older-style search pages, the search icon to submit your search.
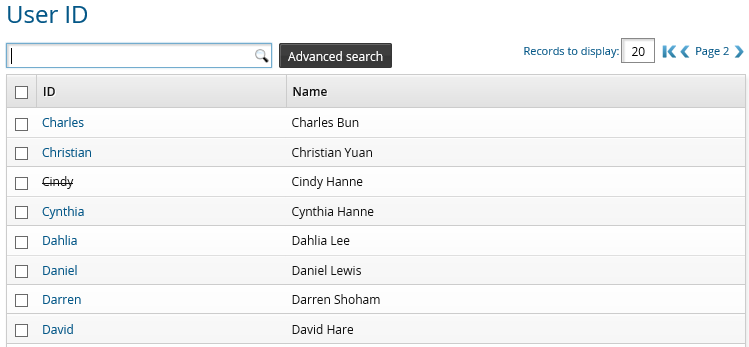
Unlike other (non-report) search pages, Bravura Security Fabric matches on hidden fields, not just the columns displayed on the page. Invalidated users are displayed with strike-through lettering. The Advanced search page lists all searchable attributes.
Advanced search page (older style)
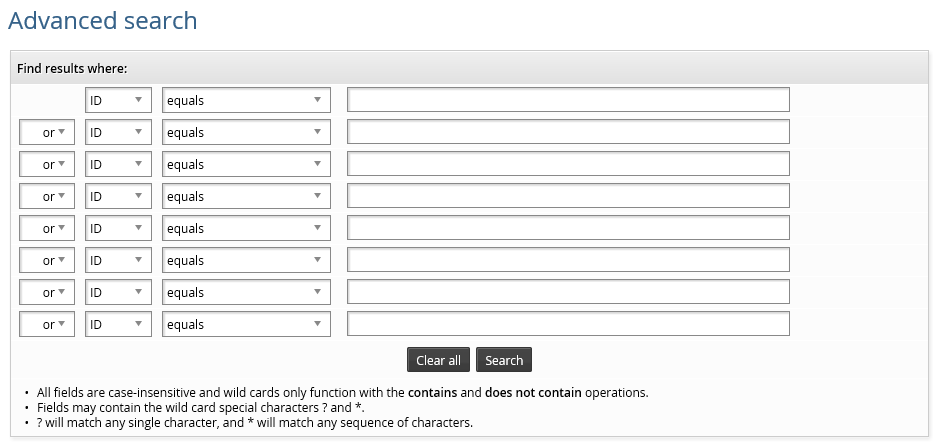
To create an advanced field search query on older-style search pages:
Click Advanced search on the object list page.
Select a field name or property from the first drop-down list in the first empty row.
Select a comparison method from the second drop-down list.
Type a value in the text field, or select a value from the drop-down list.
Repeat steps 2 through 4 in the next row if you want to add more search expressions.
If you have multiple search expressions, from the first drop-down list in the second row, select:
"or" to match on either the current or previous row.
"and" to match on both the current and previous row.
Repeat this for following rows if required.
Note
When using mixed and/or search expressions, "AND" takes precedence over "OR". For example:
Expression1 AND Expression2 OR Expression3 AND Expression4should be interpreted as
(Expression1 AND Expression2 ) OR (Expression3 AND Expression4)Click Search.
See also
Searching provides more information on standard advanced searching and saving searches.
Viewing saved reports
Users require the "Manage reports" administrative right in order to access the Manage reports (RPT) module. They can be added to the REPORT_READERS administrator group to be granted this right. Membership criteria are defined by the _REPORT_READERS_ user class.
Users must belong to the same administration group to see each other's saved reports. When a user saves a report, it is associated with each administration group they belong to at that time. If the user is an individual administrator and does not belong to an administration group, the saved report will not be associated with any group and will not be visible to other users. The association of administration groups to saved reports is stored in the
admingrprptSQL table.Superusers can view other users' saved reports, but non-superusers cannot access superusers' saved reports.
Note
When clicking the Run option on a saved report, it will overwrite the previously saved report data with the newly generated information.
To view saved reports:
Click Manage reports > Saved reports, then select My saved reports or Other users' saved reports.
Click the view icon
for the report you want to view, or use the Advanced search to narrow down the list of saved reports.Optionally, click the appropriate button in the Download column to download the report in CSV, PDF, HTML, or PNG format.
The Download image
 icon only appears when the report contains graphics.
Note
Saved reports are not propagated to replication nodes.
Adding a custom report
Custom reports provides means to generate reports that are not necessarily sourced from the main instance database.
The custom reports are transparent within the product. Just like built-in reports, they can be saved, scheduled, emailed and exported for later consumption.
When creating custom reports, the following assumptions apply:
The custom report is being sourced from a Python script.
The language is English. There is no support for internationalization at this time.
There is no inherent date handling. All date inputs are valued as inputted with no conversion for timezone.
Creating a custom report
To create a custom report in Python:
Import the report library from
IDMLib.Initialize a report object. This should contain:
Report title
Report category
Report description
If you want the report to be included under a specific category, use an existing category name when initializing a report object in your Python script. The existing category name is defined in report.py in the \<instance>\idmlib\ directory.
Set the headers of the report table (using add_headers() method).
The number of headers and their values will not change once this is done.
Construct the search criteria.
There are methods, defined in
report.pyin the \<instance>\idmlib\ directory, to add different search fields.Call the start (cb) method, passing the function name of the callback that will handle the processing of the data.
Registering a custom report
Registering a report is the act of importing the custom report into the report module. Once correctly registered, the custom report should be indistinguishable from a built-in report.
To import the report:
Ensure that Python 3.14.5+ is installed and added to the operating system PATH variable.
To check whether Python recognizes
IDMLib:Open a command line prompt and navigate to the <Program Files path>\Bravura Security\Bravura Security Fabric\<instance>\ directory.
Type python , and press Enter to start the Python interpreter.
On the Python interpreter command line, type from idmlib import report, and press Enter .
If
IDMLibis recognized, there should be no error returned.
Copy the script file into the \<instance>\report\ directory.
Log in to Bravura Security Fabric and navigate to Manage the system > Workflow > Options > Plugins.
In the PLUGIN PROGRAM field, specify:
.py <Python Installation Path>.Navigate to Manage the system > Modules > Manage reports (RPT).
In the ALLOWED REPORTS CUSTOM field, type the path, file name and extension of the report script relative to the \<instance>\report\ directory.
For multiple reports, include the report script names in a comma-separated list.
For example, if the report script, sample.py is located in \<instance>\report\pam\, then specify pam\sample.py only.
If the script contains any errors, it will not show up in the Manage reports (RPT) module. The Manage reports > Reports page will display which custom reports have errors detected in them.
Troubleshooting custom reports
A method is provided in order to troubleshoot custom reports. Within the \<instance>\report\ directory, run the following command:
<Script>.py <Action>
where <Script> is the custom report script and <Action> is one of:
Argument | Description |
|---|---|
-h, –help | Display the help message and exit. |
-query | Returns the KVGroup of search criteria to display. |
-queryinfo | Returns report title, category, and description details. |
-queryheaders | Returns headers defined in script. The number of entries must match the number of header columns defined. |
-testinput <testinput> | Generate empty search criteria KVGroup input <testinput>. |
-testrun <testrun> | Dumps all query info and executes using search criteria defined in KVGroup file <testrun> |
-execute | Executes search query. Expects initial KVGroup. |
Sample custom report
A sample report, example-custom-report.py, is located in samples\idmlib\report\.
If you cannot find the sample file, try re-running setup to modify your installation. Sample files are automatically installed with complete (typical) installations. You can select them in custom installations.