Health check
Bravura Security Fabric servers can only be reliable if the environment they operate in is reliable. The Health check monitor reports on issues that may hinder performance.
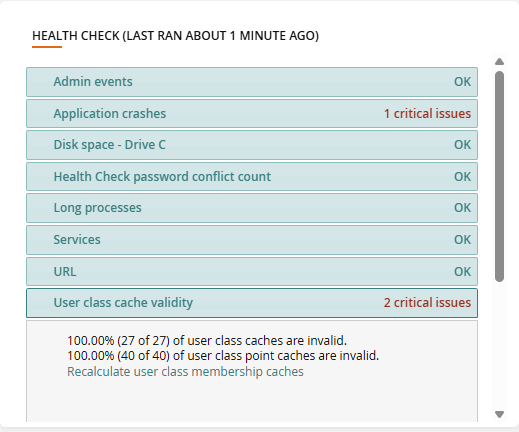
Health check monitor is installed and enabled when Bravura Security Fabric is installed. It periodically reports the status of the following components:
Admin events
The
Functional.hid_healthcheck_admin_eventscomponent scans the Windows event logs for critical failures related to the replication queue or theloaddbstored procedure.Application crashes
The
Functional.hid_healthcheck_app_crashescomponent scans the Windows event logs for application crashes that occurred within a specified number of days.Disk space - Drive C
The
Functional.hid_healthcheck_disk_spacecomponent provides an alert when the configured disk drive free space drops below the configured thresholds. Bravura Security Fabric administrators can customize this component, including adding additional drives to monitor and adjusting the alert thresholds.Health check password conflict count
The
Functional.hid_healthcheck_pwd_conflict_countcomponent should be enabled for Bravura Privilege. It runspwdconflictsto identify existing password conflicts.Long processes
The
Functional.hid_healthcheck_long_processescomponent checks for and flags processes running under the Bravura Security Fabric instance directory on the server that run for longer than the configured threshold. You can use this component, for example, to check for stuck listing agents configured with infinite timeout, which would prevent auto discovery from proceeding, and alert an administrator.Services
The
Functional.hid_healthcheck_servicescomponent checks whether the required Bravura Security Fabric services are running and flags any that have stopped.URL
The
Functional.hid_healthcheck_urlcomponent attempts to connect to the configured URL to check whether the web UI or another monitored application endpoint is available.User class cache validity
The
Functional.hid_healthcheck_uc_cache_validitycomponent checks what percentage of user class caches or user class point caches have expired. Click Recalculate user class caches to recalculate all or only expired caches.
By default, the Health Check Monitor provides generic functionality. To get the most from this feature, configure the various components to suit your particular environment. At a minimum, the following updates are recommended:
Add email addresses to receive email notifications.
Add additional drives to monitor and set the alert thresholds to suit your environment.
Add URLs to monitor.
See the Health check monitor configuration example for a walkthrough of the common customizations recommended.
If none of the health check tasks are needed, the product administrator can disable the Windows Scheduler > Library > HID Healthcheck task and either disable the health check components or uninstall them. See Components for more information on how to do this.
Dashboard
The status of the health check components is displayed on a dashboard in the Front-end module. You can view the details by expanding each individual component.

The Health check monitor runs through Windows Task Scheduler. The task runs every five minutes by default. Use Windows Task Scheduler to modify the interval to suit your needs.
Each test displays one of two statuses:
OK - the component is working normally.
Critical - an outstanding issue requires immediate attention.
Health check monitor configuration example
This example demonstrates how to edit the hid_healthcheck_configuration table to make the following changes:
Add product administrator email addresses.
Add additional drives and configure threshold values to monitor.
Add a second URL to monitor.
Edit the processes monitored.
From the main menu, click Manage external data store.
Click hid_healthcheck_configuration.
Search for
Namespace='HEALTHCHECK_DISK_SPACE'.Edit the row for the EMAILS setting and add the email address of the product administrator.
Add the following new set of entries to have health check monitor other disk partitions. Ensure the Key value is different from the existing entries.
Namespace
Setting
Key
Value
Description
HEALTHCHECK_DISK_SPACE
DESCRIPTION
2
Disk space - Drive D
The description.
HEALTHCHECK_DISK_SPACE
EMAILS
2
alerts@example.com
Comma-separated list of emails.
HEALTHCHECK_DISK_SPACE
EMAIL_THRESHOLD
2
info
Threshold to send emails.
HEALTHCHECK_DISK_SPACE
EMAIL_SEND_DELAY
2
60
Delay between emails in minutes.
HEALTHCHECK_DISK_SPACE
DEVICE_ID
2
D:
Device ID for drive.
HEALTHCHECK_DISK_SPACE
MIN_SIZE
2
30
Critical threshold for disk size in GB.
HEALTHCHECK_DISK_SPACE
MIN_FREE
2
5
Critical threshold for free disk space in GB.
HEALTHCHECK_DISK_SPACE
MIN_PERCENT_FREE
2
10
Critical threshold for percent free disk space.
You can edit the DEVICE_ID value on the existing entry from C: to another drive if you do not want to monitor C:.
Best practice
Ensure the MIN_SIZE, MIN_FREE, and MIN_PERCENT_FREE values are slightly smaller than the values from the
service\iddb.cfgconfiguration file, so that the warning email about running out of space goes out before the Database Service actually runs out of space.Search for
Namespace='HEALTHCHECK_APP_CRASHES'.Edit the row for the EMAILS setting and add the email address of the product administrator.
Search for
Namespace='HEALTHCHECK_ADMIN_EVENTS'.Edit the row for the EMAILS setting and add the email address of the product administrator.
Search for
Namespace='HEALTHCHECK_URL'.Edit the row for the EMAILS setting and add the email address of the product administrator.
Edit the URL setting and add all comma-delimited URLs to monitor.
Search for
Namespace='HEALTHCHECK_SERVICES'.Edit the row for the EMAILS setting and add the email address of the product administrator.
Search for
Namespace='HEALTHCHECK_LONG_PROCESSES'.Edit the row for the EMAILS setting and add the email address of the product administrator.
Edit the PROCESS_WHITELIST row to allow processes to be long-running and exclude them from monitoring.
Edit the PROCESS_TIMESPAN row to a value acceptable for your organization.
Search for
Namespace='HEALTHCHECK_PASSWORD_CONFLICT_COUNT'.Edit the row for the EMAILS setting and add the email address of the product administrator.
See also:
Components for more detailed information about components.