Replication telemetry
For instances with more than one node in replication , on the Database replication page you can find all the nodes in the instance, and clicking on each of them leads to a page with replication details. That data in the application UI describes only the most recent replication situation (up to 5 minutes of statistics at the bottom of the page).
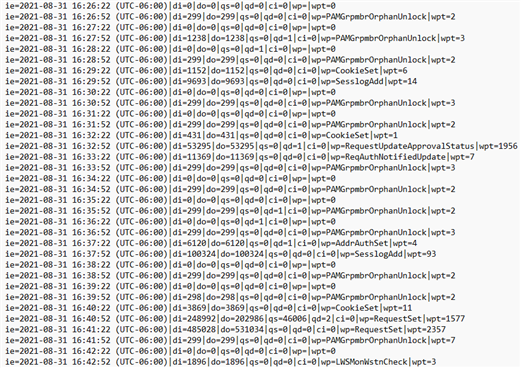
More detail is saved in telemetry files in the instance's db\ directory, like the files shown below:
The receive queue telemetry (-recv-) is useful in troubleshooting replication delays caused by slow or stuck execution on the node where the files are.
The send queue telemetry (-send-) is useful in troubleshooting inter-node communication errors. For example when:
The network is down between the node that is trying to send, where the file is located, and the node mentioned in the file name
or
The Database service (
iddb) is down or in DB_COMMIT_SUSPEND mode on the node mentioned in the file name
Those files log one entry every 30 seconds, with the following data:
ie=timestamp of the event
di="data in" (how much data was added to the queue in that 30 second interval)
do="data out" (how much data was processed on the current node's database and removed from the queue in that 30 second interval)
qs="queue size" (in bytes)
qd="queue delay" (in seconds)
ci="current_item" (the procedure that the receive queue is currently running. This doesn't exist for send queue telemetry)
wp="worst proc" (the stored procedure that ran longest during that 30 second interval)
wpt="worst proc time" (how long that stored procedure ran, in milliseconds)
The "qd" entries, collected from the telemetry file for a specific duration, can be used (in a third party spreadsheet or log analyzer) to draw up a graph of the replication delay for a day, week, or even month.