Privileged access dashboards
License requirement
 Applies to Bravura Privilege
Product administrators with the "View privileged access dashboard" privilege can click View dashboards > Privileged access to view live summary reports.
You can change the span of the results by selecting the time span from the drop-down boxes. You can generate more detailed reports from the menu.
There are bar graphs for the number of check-outs, blocked check-outs, pending check-outs and pending requests for managed accounts and group sets.
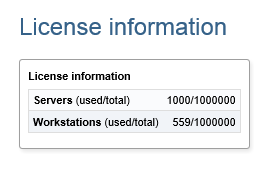
This dashboard reports on the number of servers and workstations managed by Bravura Security Fabric . Servers and workstations are counted if they are non-vault, non-deleted managed systems, belong to a primary managed system policy (not historical), and have an account with at least one password on a managed system policy . The type defaults to server unless it was auto discovered and the source of discovery declared it as a workstation.
To access this dashboard, click View dashboards > Privileged access > License information.
This dashboard does not use cached data.
Product administrators can view other license information on the Manage the system main menu .
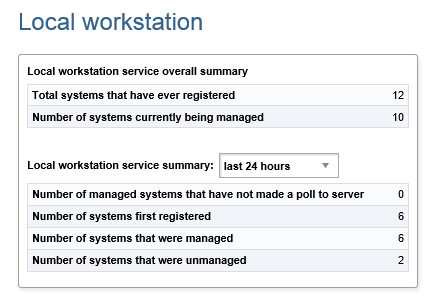
This dashboard reports on local workstation service statistics, including the number that have registered to the Bravura Privilege server, number of systems that are currently managed by Bravura Privilege , and number of systems that are unmanaged.
To access this dashboard, click View dashboards > Privileged access > Local workstation. This dashboard is split into two sections:
Local workstation service overall summary: these statistics are not based on a time interval
Local workstation service summary: these statistics are restricted to the specified time interval. You can select various time intervals from the drop-down list to calculate the statistics.
This dashboard does not use cached data.
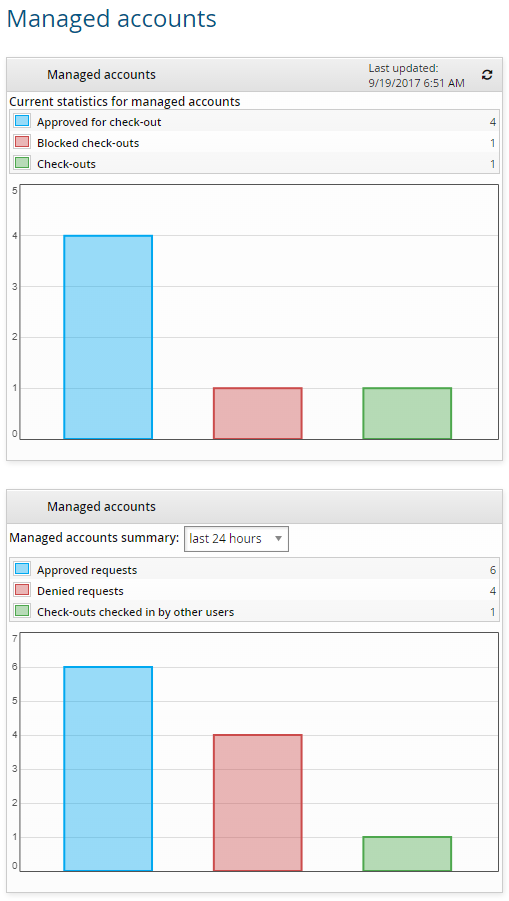
This dashboard reports on managed account statistics, including the number of accounts currently checked out, blocked check-outs, and requests approved for check-out.
To access this dashboard, click View dashboards > Privileged access > Managed accounts. This dashboard is split into two sections:
Current statistics for managed accounts: these statistics are not based on a time interval
Managed accounts summary: these statistics are restricted to the specified time interval. You can select various time intervals from the drop-down list to calculate the statistics.
Only the current statistics for managed accounts are cached.
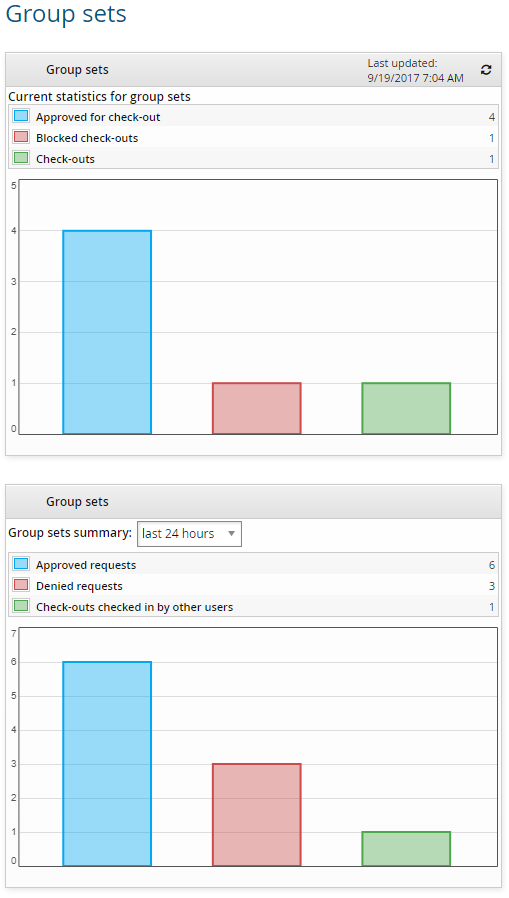
This dashboard reports on group set statistics, including the number of group sets currently checked out, blocked check-outs, and requests approved for check-out.
To access this dashboard, click View dashboards > Privileged access > Group sets. This dashboard is split into two sections:
Current statistics for group sets: these statistics are not based on a time interval
Group sets summary: these statistics are restricted to the specified time interval. You can select various time intervals from the drop-down list to calculate the statistics.
Only the current statistics for group sets are cached.
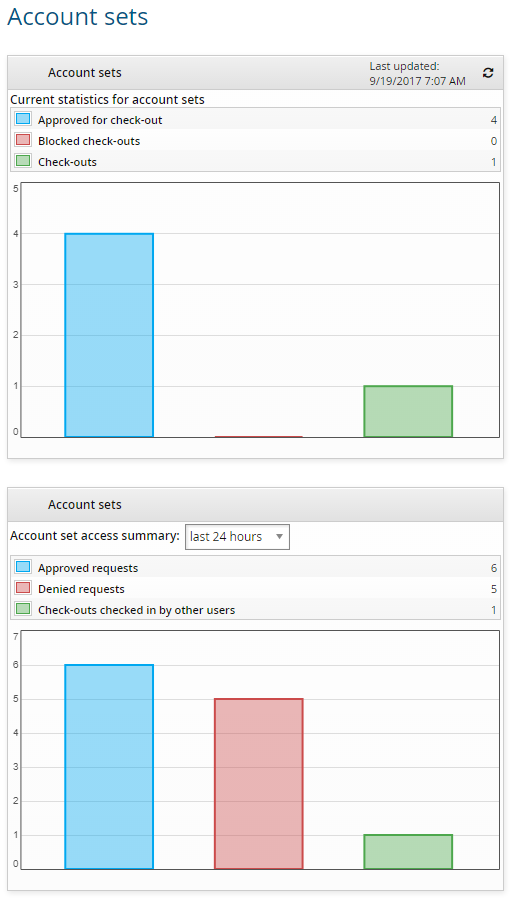
This dashboard reports on account set statistics, including the number of account sets currently checked out, blocked, and approved for check-out.
To access this dashboard, click View dashboards > Privileged access > Account sets. This dashboard is split into two sections:
Current statistics for account sets: these statistics are not based on a time interval
Account set access summary: these statistics are restricted to the specified time interval. You can select various time intervals from the drop-down list to calculate the statistics.
Only the current statistics for account sets are cached.
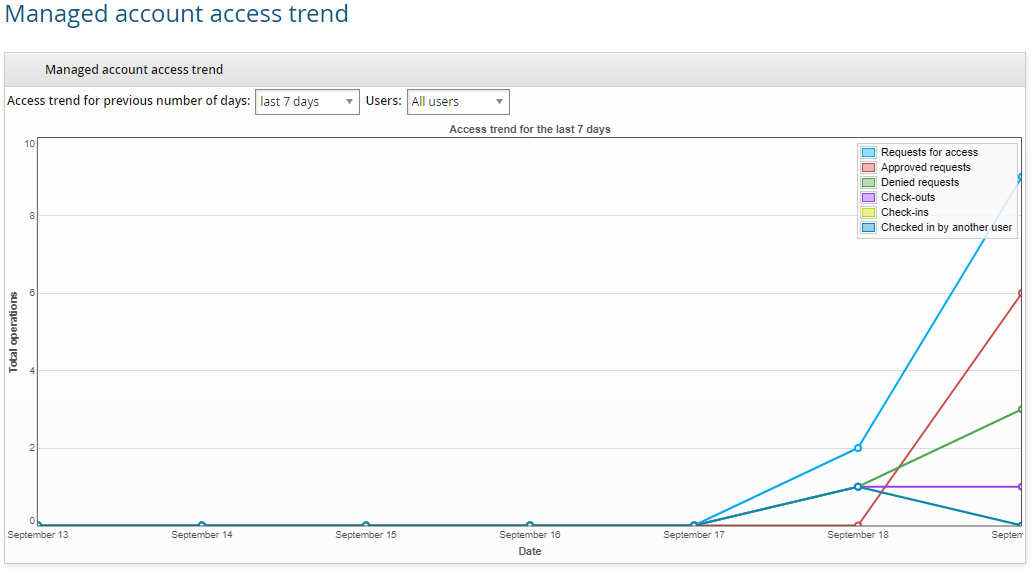
This dashboard reports on the trend analysis of managed account access check-outs, including the number of requests for access, approved requests, denied requests, and accounts checked out and checked in. You can select various time intervals and user profiles from the drop-down list to calculate the statistics.
To access this dashboard, click View dashboards > Privileged access > Managed account access trend.
In addition, product administrators with the "View privileged access dashboard" privilege also require the "View properties for this policy" access control for the managed system policy the managed accounts are bound to.
This dashboard does not use cached data.
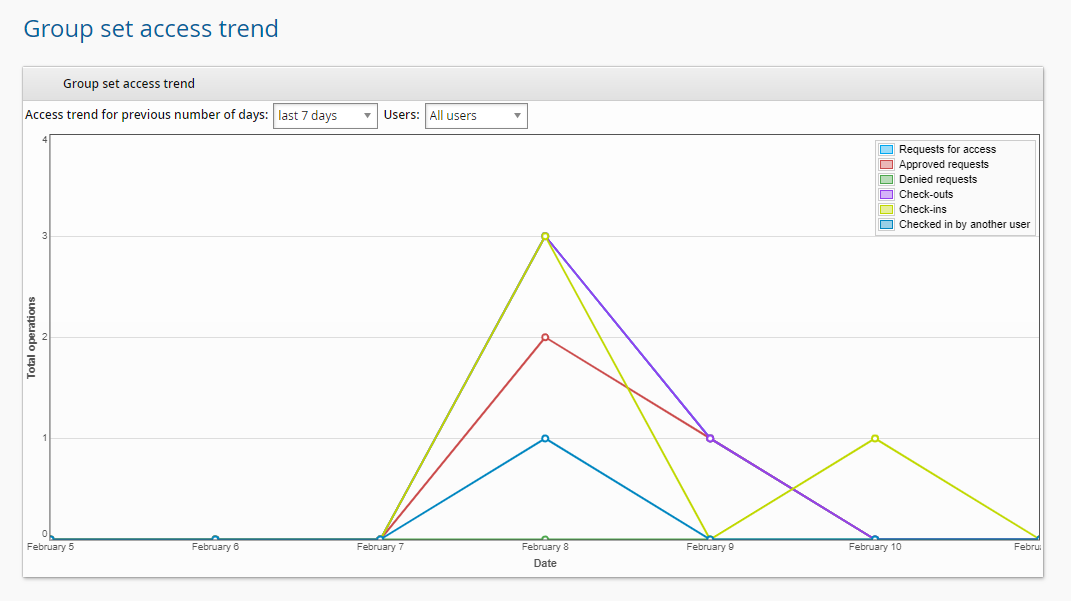
This dashboard reports on the trend analysis of group set access check-outs, including the number of requests for access, approved requests, denied requests, and group sets checked out and checked in. You can select various time intervals and user profiles from the drop-down list to calculate the statistics.
To access this dashboard, click View dashboards > Privileged access > Group set access trend.
In addition, product administrators with the "View privileged access dashboard" privilege also require the "View properties for this policy" access control for the managed system policy the group sets are bound to.
This dashboard does not use cached data.
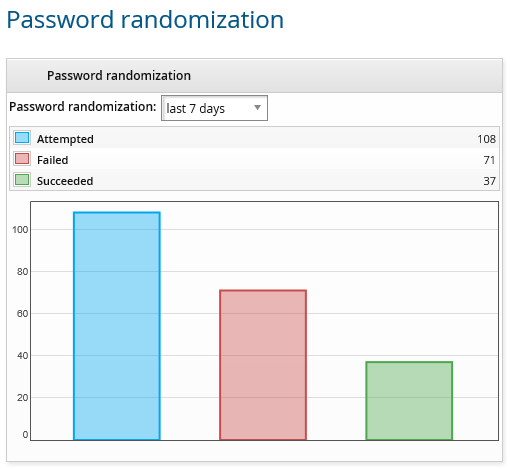
This dashboard reports on password changes statistics for managed accounts including successful and failed changes. These statistics are restricted to the specified time interval. You can select various time intervals from the drop-down list to calculate the statistics.
To access this dashboard, click View dashboards > Privileged access > Password randomization.
This dashboard does not use cached data.
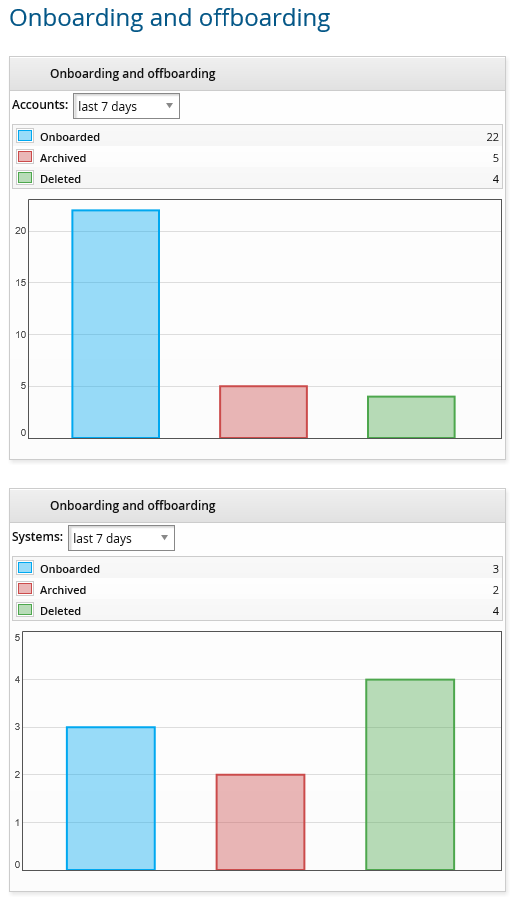
This dashboard reports on statistic of systems and accounts that have been onboarded and offboarded. These statistics are restricted to the specified time interval. You can select various time intervals from the drop-down list to calculate the statistics.
To access this dashboard, click View dashboards > Privileged access > Onboarding and offboarding.
This dashboard does not use cached data.