Workflow dashboard
License requirement

 Applies to Bravura Identity or Bravura Privilege
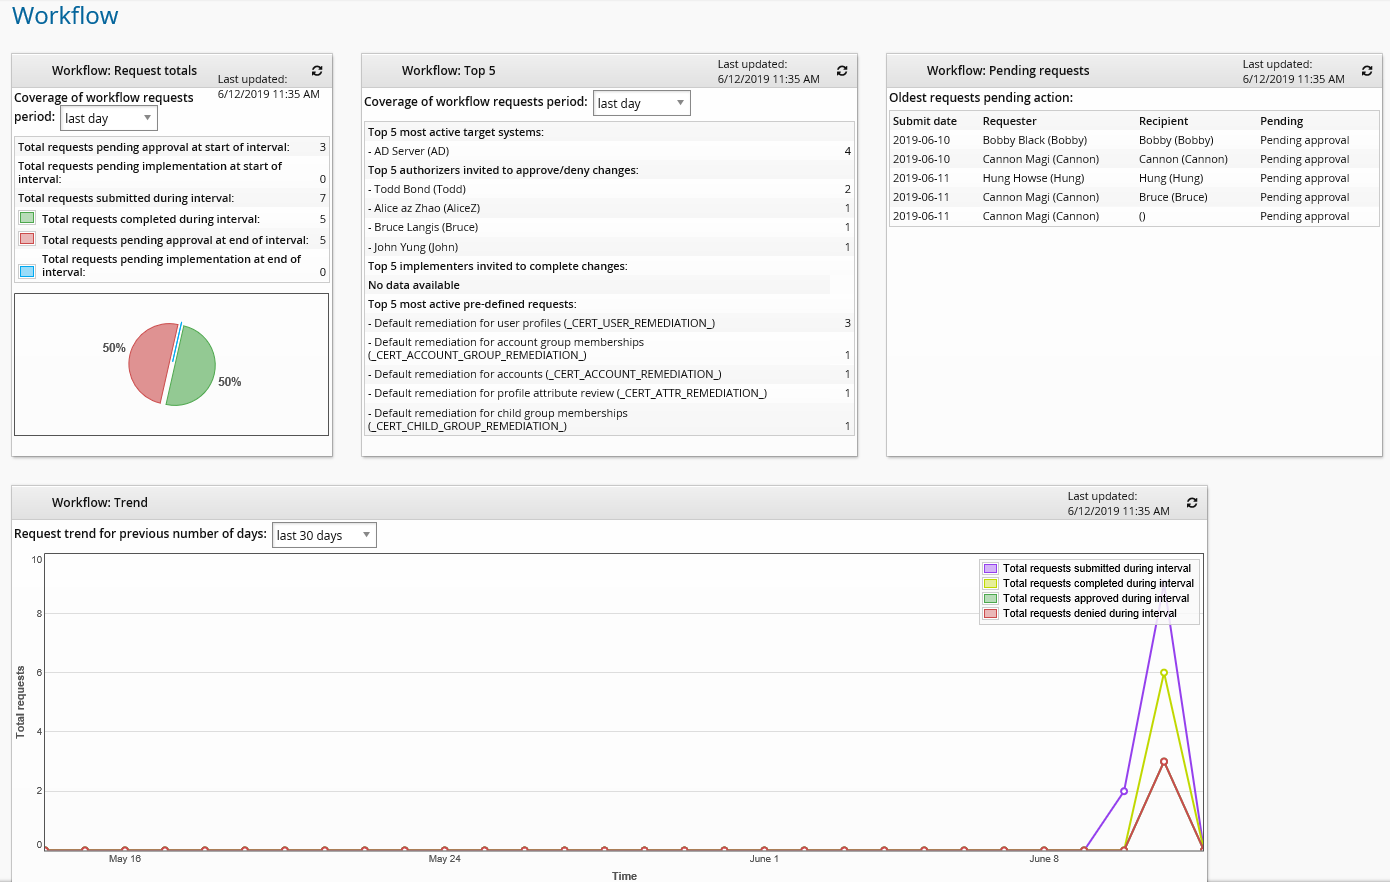
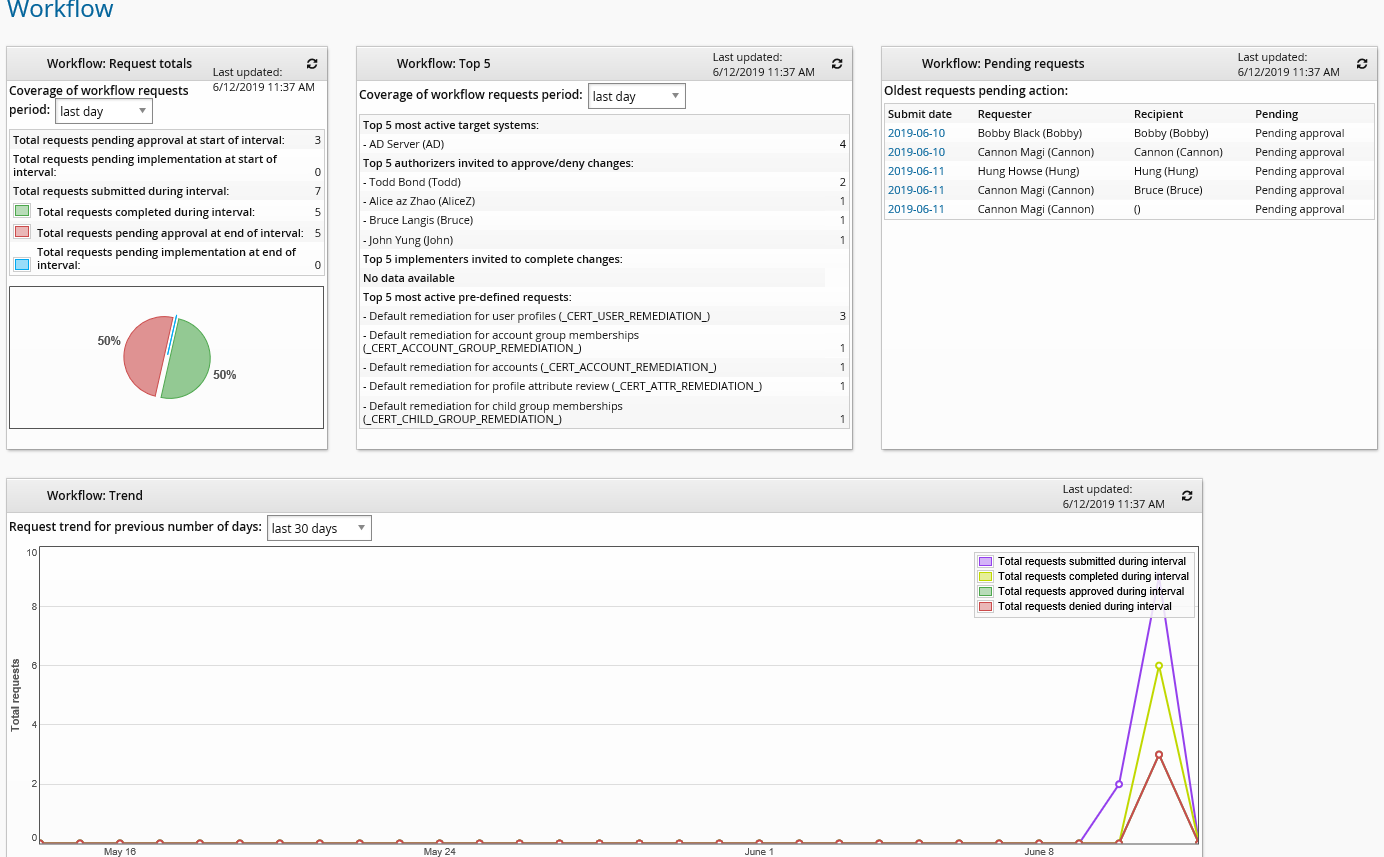
Product administrators with the "View workflow dashboard" privilege can click View dashboards > Workflow to see statistics of requests that are submitted, completed, pending authorization and pending implementation.
A pie graph is included to display the following statistics:
Total requests completed during interval
Total requests pending approval at end of interval
Total requests pending implementation at end of interval
The dashboard also includes statistics for Top 5 most active target systems, Top 5 authorizers invited to approve/deny changes, Top 5 implementers invited to complete changes, Top 5 most active pre-defined requests and the 10 Oldest requests that are pending action.
The line graph included at the bottom of the page displays the trend of requests submitted, completed, approved and denied per day over a period of days. A circle on the line graph represents a data point over a specific day. Hovering over a circle will highlight the data point.
The pie graph is only visible if there is data during the selected time period. All the data on this page is displayed based on UTC.
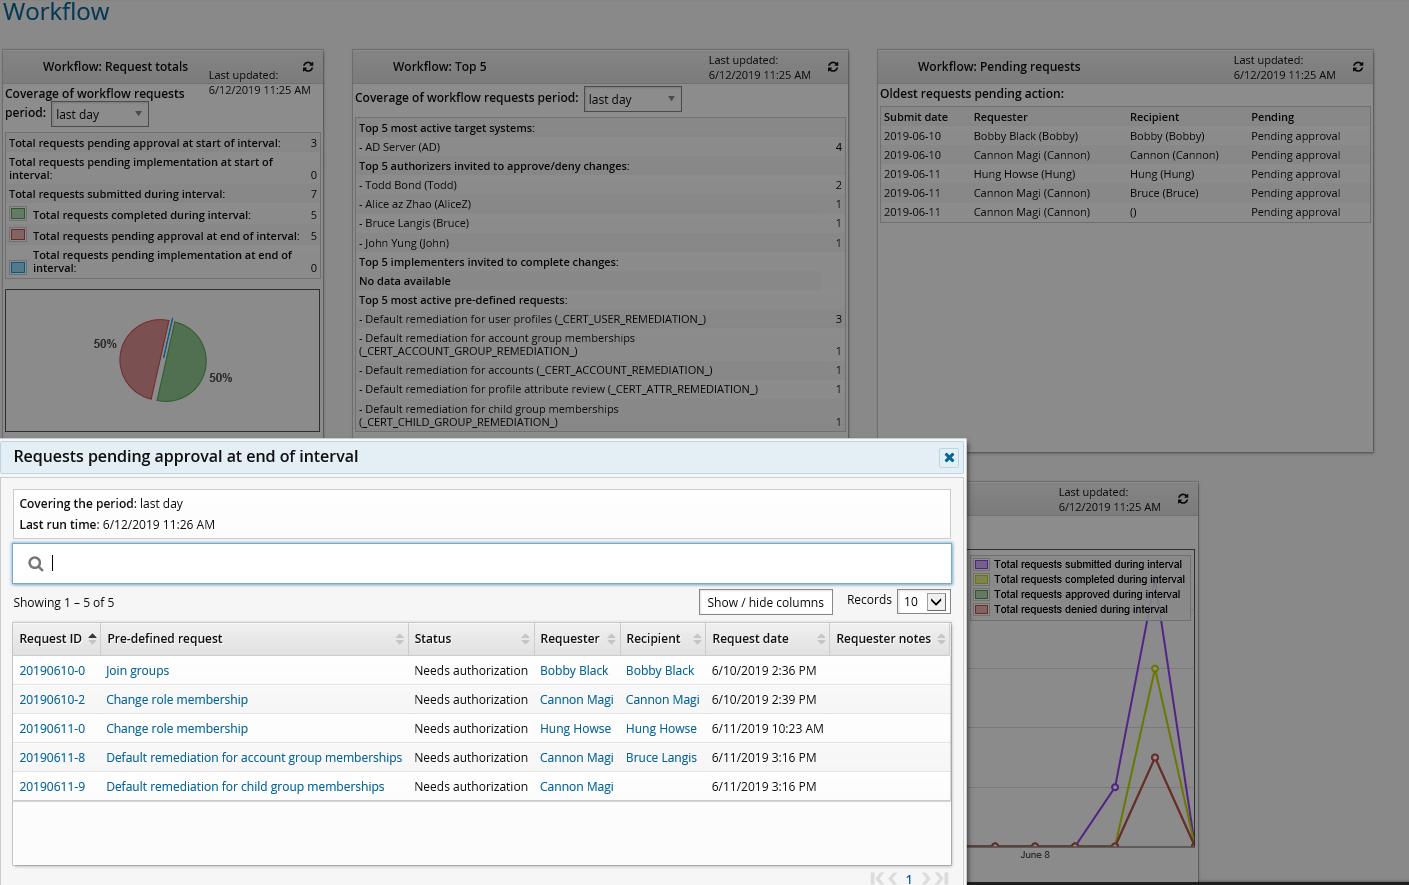
If the product administrator is also a workflow manager, data in the "Submit date" column in "Workflow:Pending request" box is presented as linkable. The request detail page will be opened by clicking these links.
Graphs and data
If you have the "View workflow dashboard" privilege, you can view in-depth data in a pop-up window by clicking on elements on the pie chart or circles on the line graph.