Observed replication queue increases
If you notice that some configuration or data is different between replicated nodes, investigate each node to identify potential problems.
Click on Manage the system > Maintenance > Database replication, then click on each node even if they have green checkmarks.
The checkmark at the end of each row becomes a red "x" if an issue was detected by the Database service (iddb) when contacting or communicating with the other node's iddb . Mouse over the x to get a quick message on the status of that communication.
Mouse over the clock icon at the beginning of each row to check if the server clocks between the two servers differ by more than 60 seconds, at which point the database services stop sending messages to each other, causing the replication queues to increase.
Click on each of the nodes to observe its runtime details and configuration options on a separate tab. The sections in each node's Details page are really important, and each section describes the communication in ONE direction (send or receive) with a different node. Each node has a different SEND Queue and RECEIVE Queue for each other node in the instance.
The important values to check are described below:
Backlog size
The Backlog size value is a measure of the replication data that is pending and waiting to be synchronized across the nodes.
As long as there is data in the replication backlogs, the nodes will show different data in their WebUI as a temporary synchronization issue.
If sprocs fail to be applied on some nodes while they succeed on others, the sync issue becomes more permanent.
Some sprocs may fail once may succeed later if the issue that caused the original failure is resolved. For example, when a WstnPwdCheckOut fails with "stored procedure exception" = "No lock to check out password", and a user performs a successful check-in on the affected account on the node where that sproc failed, the next WstnPwdCheckOut on the same account will succeed on that node as well.
Queue delay
Queue delay represents the time difference between when a replication event is generated on the source node and when it is actually processed on the destination node. This delay can be an indicator of communication issues between nodes, such as network latency or problems with the database server that may be slowing down the replication process. For example, if it grows, the iddb from the observed node is having trouble communicating with the node listed on the page with the increased delay.
Queue size
The Queue size refers to the amount of data waiting to be replicated from one node to another within the system. It is a measure of the replication data that has been generated but not yet processed or sent to the destination node. A consistently large or growing queue size may suggest issues with network connectivity, database performance or sproc issues, or other system bottlenecks that could be impacting the efficiency of data replication.
Send queues grow when the iddb service from the observed node has trouble connecting to the iddb of the node in the title of the specific page section.
Possible connection issues include: net latency, slow-running iddb on the sending or receiving end, or handle/socket exhaustion on sending or receiving node.
In rare cases:
Treceiving node cannot write to its incoming queues. To check for this, run this filter on the receiving node's current log file and receive a non-zero result:
grep -c "queue: file size .0. smaller that minimum size" idmsuite.log
The receiving node is out of non-pooling RAM:
grep -c "create accept thread" idmsuite.log
A non-zero result, especially if the tail of those results is recent, means
iddbcan't create receive threads.
Receive queues grow when there's a problem on the backend database of the receiving node.
All receive queues tend to grow at once, with similar values, if all the nodes are under load.
Possible database issues include:
Lack of connectivity from a node to its database
Network comm delay
Resource exhaustion issues on the database server
Locked tables, either from database maintenance or because other sprocs are updating the tables at the time.
A subset of the latter are blocked sprocs, which either process too slowly or are waiting for themselves or other sprocs to finish, or are using obsolete execution plans, calculated by the database engine before the data they apply to was modified by another sproc - including those triggered by database maintenance tasks.
Time since last sproc ran
If this value increases, a sproc is likely taking a lot of time on the database that it is happening.
As of Bravura Security Fabric version 12.5.0 the iddb service saves a "snapshot" of what can be seen in the Database replication details pages per node, in telemetry (*.rst) files located in the instance's db\ directory, with one record every 30 seconds.
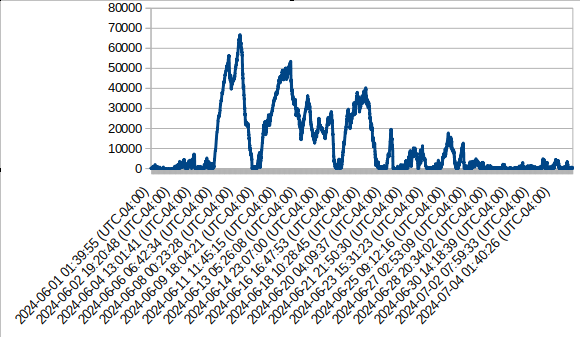
Those files can be parsed in many ways for the rich data present in them. For example to get a trace of replication delays in seconds, you could use the command:
grep "2024-0[67]" telemetry-recv-bravura1.local_hipam.rst | awk -F'|' '{print $1,",",$5}'|sed s/ie=//|sed s/qd=//>times-FTC706.csvIn the above command:
The first grep collects the entries from months 6 and 7 of 2024.
Those entries are piped into awk, that preserves two columns: the timestamp and qd (queue delay).
The next two sed pipes strip the "metadata".
The resulting entries are placed in a CSV file.
You can then use a spreadsheet program to render a chart from the two data columns, like this:
These are the counts of entries listing worst sproc duration >= 6 digits ([0-9]{6,} in miliseconds, for those two months. These are not complete counts like the ones which could be collected with stored procedure performance entries in idmsuite.log , because in 30 seconds there could be thousands of sprocs executed, and only one or two are recorded in these telemetry files :
egrep -c "2024-0[67].*wpt=[0-9]{6,}" telemetry-recv-PTC-bravura1.local_hipam.rst
4534
... and itemized by counts of sprocs:
egrep "2024-0[67].*wpt=[0-9]{6,}" telemetry-recv-bravura1.local_hipam.rst|egrep -o
      "wp=[^|]+"|sort|uniq -c|sort -k1,1nr

3491 wp=PolicyRuleComputerPrepare
388 wp=ManageRuleComputerPrepare
335 wp=WstnPwdReset
264 wp=WstnPwdUpdateStatus
34 wp=DashWorkStatsCompute
13 wp=WstnPwdQueueRandomize
5 wp=WstnPwdResetFail
3 wp=LoaddbInit
These are the fields present in each entry of the telemetry files:
interval_end = "ie"; timestamp for the end of the 30-second interval whose stats are captured in this line
dataflow_in = "di"; bytes added to the queue in this interval
dataflow_out = "do"; bytes removed from the queue in this interval
queue_size = "qs"; size of the queue in bytes at the end of the interval
queue_delay = "qd"; queue delay in seconds at the end of the interval
current_item = "ci"; on receive queues, whatever stored proc was running at the end of the interval
worst_proc = "wp"; on receive queues, the slowest proc that ran during this interval
worst_proc_time = "wpt"; on receive queues, the duration in miliseconds of the slowest proc that ran during this interval
Resolution procedure
If the above is happening,
Bravura Security recommends disabling the PSUPDATE process and other automation that would increase the replication queue.
Until you figure out what the sproc is and if needed, kill its process or restart the affected database.
If the values are decreasing, all is likely fine, and the emails will stop coming as soon as the replication queues get under the configured thresholds.
If the values in the WebUI are decreasing, it means that the queues grew while DB admins (or automation) were performing maintenance on the servers, and now they are flushing.