Help desk dashboard
Product administrators who have the "View help desk dashboard" privilege can click View dashboards > Help desk to view information about all operations in the Help users (IDA) module by help desk users or help desk managers.
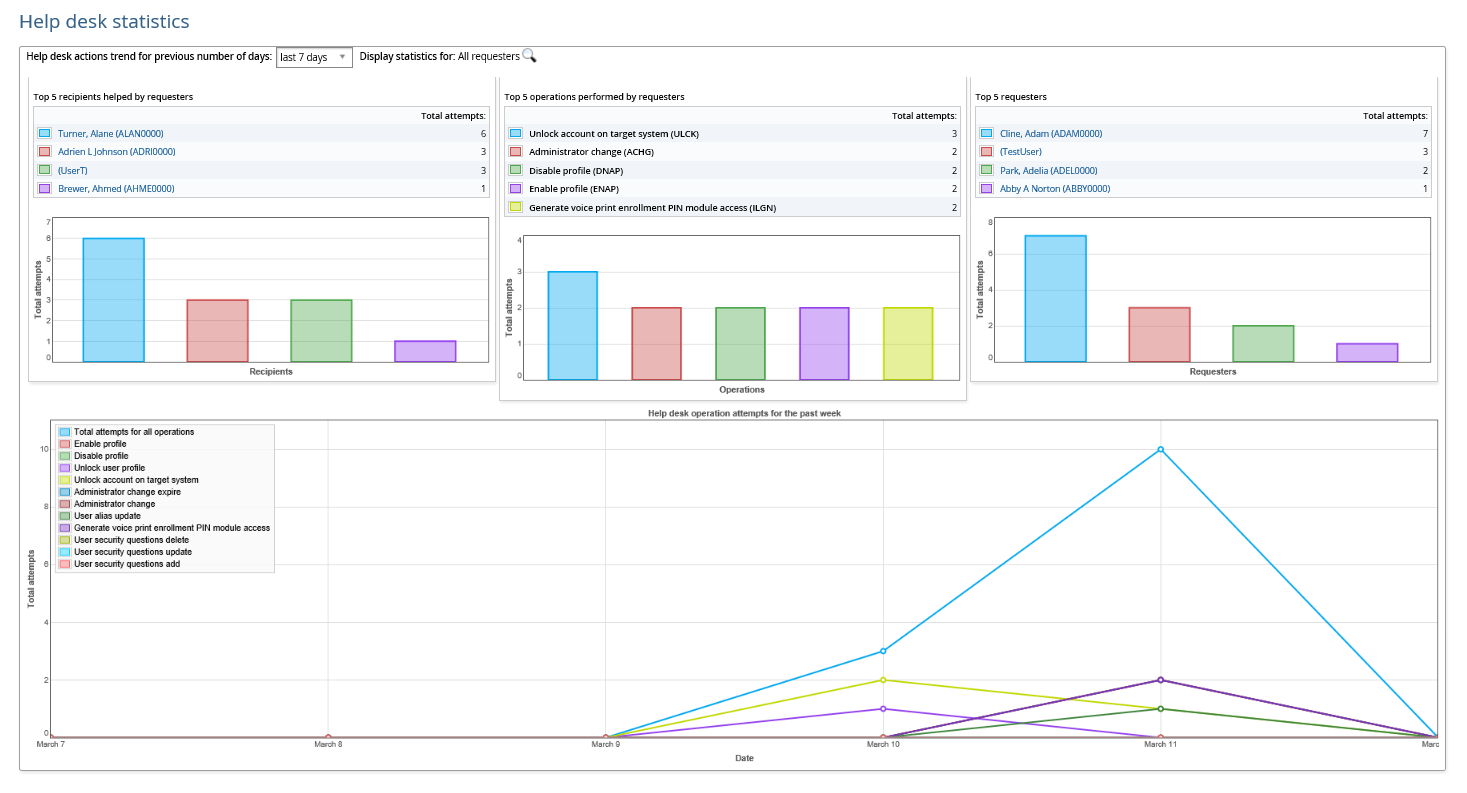
The Help desk statistics page shows three bar graphs:
Top five users helped by a help desk user or a help desk manager along with a bar chart
Top five operations performed by a help desk user or a help desk manager along with a bar chart
Top five help desk users or help desk managers performing help operations along with a bar chart
Hover over a bar to see statistic details. Click on a bar to view a pop-up window with a list of detailed records performed for a specific user helped, a specific help operation or a help desk user or a help desk manager.
The line graph included at the bottom of the page displays the trend of performed operations per day over a period of days. You can:
Hover over the data set to see statistic details.
Click on the data set to view a pop-up window with a list of detailed records performed for a specific help desk operation. The information includes the operation that was performed, when the operation was performed, the requester, the recipient and the result.
Hover over an item in the legend to highlight the relative line on the graph.
Click on an item in the legend to enable/disable the relative line on the graph.
Use the  facility to focus the statistic on a particular user.
You can pin graphs by hovering over the pin symbol  and selecting Pin an object.